Added a longer reason why average speed might not have increased so fast.
Source Link
nick3216
  • 409
  • 2
  • 7

Last year I plotted average speed versus race distance and there's an incredibly accurate inverse relationship.
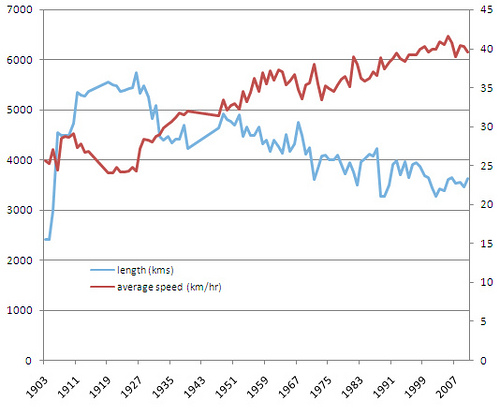
Chart

http:///www.32sixteen.com/2011/07/25/correlation-does-not-equal-causality/

But to add to my chart and flesh out the reason I think it hasn't increased so greatly. The Tour is a stage race. The average speed we have presented is the average speed of the winner of the General Classification, or "GC", not based on the fastest times of each stage.

At the start of the Tour the stages are typically flat stages, and are won by the sprinters. During these stages the eventual winner of the GC is generally looking to achieve parity with his main rivals and finish in the bunch. The bunch itself doesn't ride at the fastest average speed it can. It rides along at a "comfortable" pace, unless there is an attack, and will only achieve top speed during the closing kilometres. Each stage of the race is not run at maximum possible speed it would be if the riders expended maximal effort all day.

Once the race enters the mountains the GC contenders will look to maximise their gains over their rivals and move into the top spots fo the race overall. Even so they will typically only attack on the last climb of the day. They may use their lieutenants to try and wear down their rivals during the early parts of the day by sending out attacks. So again, each stage of the race is not run at maximum possible speed it would be if the riders expended maximal effort all day. Furthermore GC contenders will not only judge their efforts for this day, but for the forthcoming days in the mountains. Attack on day 1 in the Alps and you may lose your time gains on day 2 as fresher riders attack you.

If you plotted the average speed of the Tour based on the fastest time of each stage rather than just of the eventual GC winner you'd see a steeper rise, though for the reasonas I give above even this wouldn't be as great a rise as it would be if every stage was raced flat out.

Last year I plotted average speed versus race distance and there's an incredibly accurate inverse relationship.

Chart

http:///www.32sixteen.com/2011/07/25/correlation-does-not-equal-causality/

Last year I plotted average speed versus race distance and there's an incredibly accurate inverse relationship.

Chart

http:///www.32sixteen.com/2011/07/25/correlation-does-not-equal-causality/

But to add to my chart and flesh out the reason I think it hasn't increased so greatly. The Tour is a stage race. The average speed we have presented is the average speed of the winner of the General Classification, or "GC", not based on the fastest times of each stage.

At the start of the Tour the stages are typically flat stages, and are won by the sprinters. During these stages the eventual winner of the GC is generally looking to achieve parity with his main rivals and finish in the bunch. The bunch itself doesn't ride at the fastest average speed it can. It rides along at a "comfortable" pace, unless there is an attack, and will only achieve top speed during the closing kilometres. Each stage of the race is not run at maximum possible speed it would be if the riders expended maximal effort all day.

Once the race enters the mountains the GC contenders will look to maximise their gains over their rivals and move into the top spots fo the race overall. Even so they will typically only attack on the last climb of the day. They may use their lieutenants to try and wear down their rivals during the early parts of the day by sending out attacks. So again, each stage of the race is not run at maximum possible speed it would be if the riders expended maximal effort all day. Furthermore GC contenders will not only judge their efforts for this day, but for the forthcoming days in the mountains. Attack on day 1 in the Alps and you may lose your time gains on day 2 as fresher riders attack you.

If you plotted the average speed of the Tour based on the fastest time of each stage rather than just of the eventual GC winner you'd see a steeper rise, though for the reasonas I give above even this wouldn't be as great a rise as it would be if every stage was raced flat out.

Embedded image in response instead of as link
Source Link
nick3216
  • 409
  • 2
  • 7

Last year I plotted average speed versus race distance and there's an incredibly accurate inverse relationship.

ChartChart

http:///www.32sixteen.com/2011/07/25/correlation-does-not-equal-causality/

Last year I plotted average speed versus race distance and there's an incredibly accurate inverse relationship.

Chart

http:///www.32sixteen.com/2011/07/25/correlation-does-not-equal-causality/

Last year I plotted average speed versus race distance and there's an incredibly accurate inverse relationship.

Chart

http:///www.32sixteen.com/2011/07/25/correlation-does-not-equal-causality/

Source Link
nick3216
  • 409
  • 2
  • 7

Last year I plotted average speed versus race distance and there's an incredibly accurate inverse relationship.

Chart

http:///www.32sixteen.com/2011/07/25/correlation-does-not-equal-causality/