> What really struck me though was that the average speeds really haven't changed much
The chart ranges from about 25km/h to over 40km/h, and that is a big change. As others have mentioned, increasing your average speed requires a non-linear increase in power applied to the pedals.
In other words, to increase average speed from 25km/h to 26km/h is easier than increasing from 40km/h to 41km/h
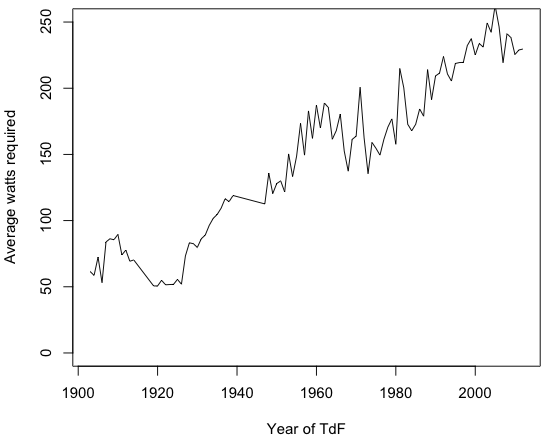
Say I were to steal a time-machine, go back and ride each TdF course, using the exact same bike. To match the winners average speed, this is the wattage I would need to produce (well, a very crude approximation):

(again, this is a very crudely approximated graph, designed to illustrate a point! It ignores stuff like wind, terrain, drafting, coasting, road surface and many other things)
From around 60 watts to 240 watts is a huge change, and it's very unlikely that TdF competitors have increased their wattage this much over time..
Part of the increase will be due to more powerful cyclists (thanks to better training and nutrition), but certainly not all of it.
The rest is likely due to technological improvements. For example, a more aerodynamic bike will decrease the power required for a given average speed, same with a lighter bike when going up hills.
------
Source for graph: Although my point should remain valid regardless of how inaccurate the above graph is, here is the messy script I used to generate it
It uses the data from [here](http://www.guardian.co.uk/news/datablog/2012/jul/23/tour-de-france-winner-list-garin-wiggins), exported to CSV (from [this document](https://docs.google.com/spreadsheet/ccc?key=0AonYZs4MzlZbdFpHWnZaTnZZNXlORTJaM3lsN0EwV2c#gid=0))
The average speed to required watts calculation could be simplified greatly, but it was easier for me to just modify the script from [my answer here](https://bicycles.stackexchange.com/a/12776/4353)!
#!/usr/bin/env python2
"""Wattage required to match pace of TdF over the years
Written in Python 2.7
"""
def Cd(desc):
"""Coefficient of drag
Coefficient of drag is a dimensionless number that relates an
objects drag force to its area and speed
"""
values = {
"tops": 1.15, # Source: "Bicycling Science" (Wilson, 2004)
"hoods": 1.0, # Source: "Bicycling Science" (Wilson, 2004)
"drops": 0.88, # Source: "The effect of crosswinds upon time trials" (Kyle,1991)
"aerobars": 0.70, # Source: "The effect of crosswinds upon time trials" (Kyle,1991)
}
return values[desc]
def A(desc):
"""Frontal area is typically measured in metres squared. A
typical cyclist presents a frontal area of 0.3 to 0.6 metres
squared depending on position. Frontal areas of an average
cyclist riding in different positions are as follows
http://www.cyclingpowermodels.com/CyclingAerodynamics.aspx
"""
values = {'tops': 0.632, 'hoods': 0.40, 'drops': 0.32}
return values[desc]
def airdensity(temp):
"""Air density in kg/m3
Values are at sea-level (I think..?)
Values from changing temperature on:
http://www.wolframalpha.com/input/?i=%28air+density+at+40%C2%B0C%29
Could calculate this:
http://en.wikipedia.org/wiki/Density_of_air
"""
values = {
0: 1.293,
10: 1.247,
20: 1.204,
30: 1.164,
40: 1.127,
}
return values[temp]
"""
F = CdA p [v^2/2]
where:
F = Aerodynamic drag force in Newtons.
p = Air density in kg/m3 (typically 1.225kg in the "standard atmosphere" at sea level)
v = Velocity (metres/second). Let's say 10.28 which is 23mph
"""
def required_wattage(speed_m_s):
"""What wattage will the mathematicallytheoretical cyclist need to
output to travel at a specific speed?
"""
position = "drops"
temp = 20 # celcius
F = Cd(position) * A(position) * airdensity(temp) * ((speed_m_s**2)/2)
watts = speed_m_s*F
return watts
#print "To travel at %sm/s in %s*C requires %.02f watts" % (v, temp, watts)
def get_stages(f):
import csv
reader = csv.reader(f)
headings = next(reader)
for row in reader:
info = dict(zip(headings, row))
yield info
if __name__ == '__main__':
years, watts = [], []
import sys
# tdf_winners.csv downloaded from
# http://www.guardian.co.uk/news/datablog/2012/jul/23/tour-de-france-winner-list-garin-wiggins
for stage in get_stages(open("tdf_winners.csv")):
speed_km_h = float(stage['Average km/h'])
dist_km = int(stage['Course distance, km'].replace(",", ""))
dist_m = dist_km * 1000
speed_m_s = (speed_km_h * 1000)/(60*60)
watts_req = required_wattage(speed_m_s)
years.append(stage['Year'])
watts.append(watts_req)
#print "%s,%.0f" % (stage['Year'], watts_req)
print "year = c(%s)" % (", ".join(str(x) for x in years))
print "watts = c(%s)" % (", ".join(str(x) for x in watts))
print """plot(x=years, y=watts, type='l', xlab="Year of TdF", ylab="Average watts required", ylim=c(0, 250))"""