In cycle racing, there are five grades or categories for climbs - Category 4, 3, 2, 1 & Hors (Above Category or HC). How do they decide what is category 1 and what makes it so hard it is a HC?
9 Answers
As has been mentioned, the actual categories are fairly subjective. Things such as the fame of a climb as well as how the organizers feel about giving out King of the Mountain points on a given stage will affect rankings.
That said, there are some general rules of thumb if you want to get an idea of how your local climb rates up to a given ranked climb in the tour though. There are always exceptions to climb rankings, but this should give you a basic list to start with.
Category 4
2km or so @ 6%
4km or so @ < 4%

Category 3
2-3km @ 8% (or less on average, but with very steep pitches)
2-4km @ 6%
4-6km @ 4%

Category 2
5-10km @ 5-7%
10+km @ 3-5%

Category 1
5-10km @ >8%
10-15km @ 6%

HC
Often Category 1 climbs as the last climb of the day
15+km @ 8%+ (Alpe D'huez, etc.)
20+km @ anything uphill. (Galibier is ~=4% over 40km if I recall correctly)
As I mentioned though, you can find exceptions for any of these. Some examples would include:
- 2006, the TdF included the Cauberg, a key climb of the Amstel Gold race. It covers about 1.5km with an average of about 5%, it was ranked Category 3. There are a couple hundred meters @ 11% on it and placed just before the finish, it shattered the peloton.
- 2010, stage 12 finished just after the Col de la Croix Neuve. This was ranked as a Category 2, despite being only 3.1km long. It averaged 10% though, so hardly easy.
- Many of the category 4 climbs in the early flat stages would be unranked on a hillier stage. They exist so there is excitement in the king of the mountains classification early.
-
7In addition to the above post, I wanted to include Strava's own way of calculating climb category : strava.zendesk.com/entries/… As they say, their system uses and objective view, while races can use more subjective reasons (and still be valid).– BibzCommented Jul 20, 2015 at 12:34
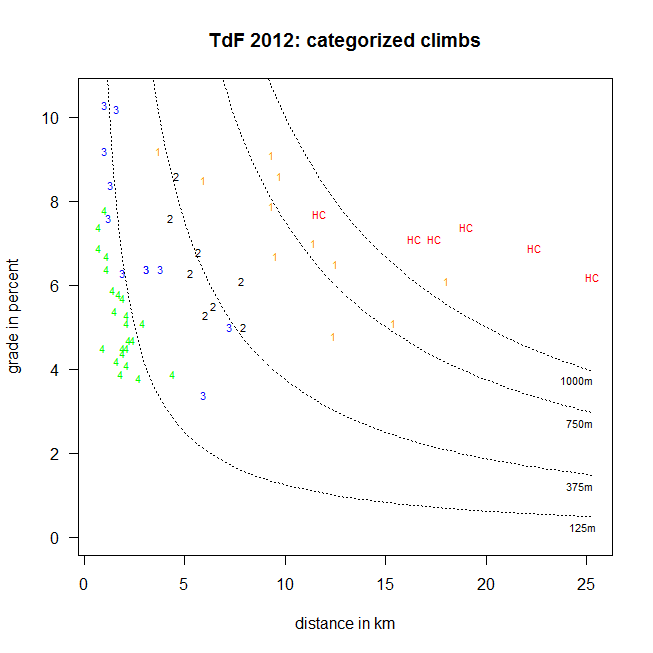
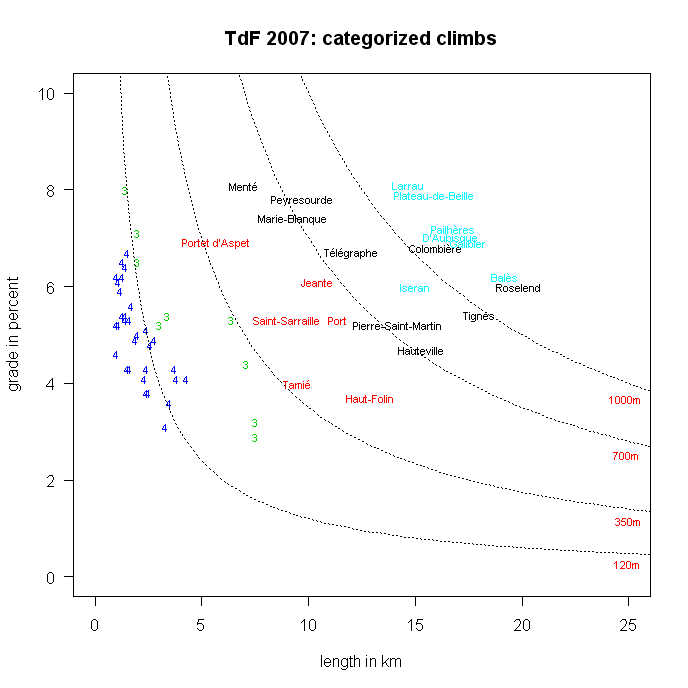
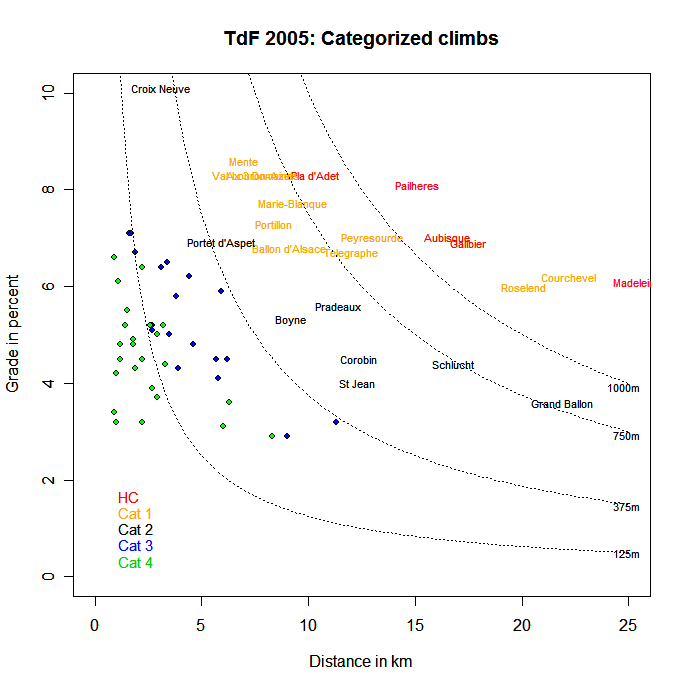
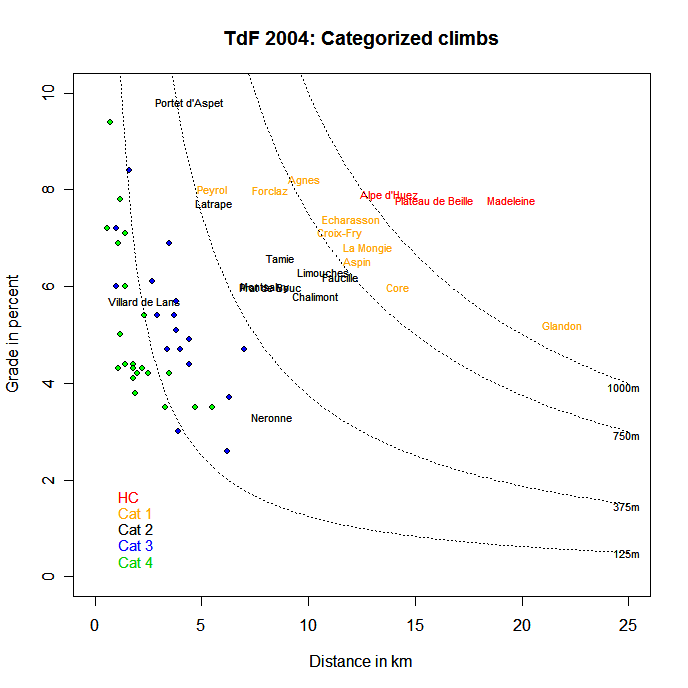
As noted above, part of the ranking of a climb depends on its placement within a stage: usually, the ending climb of a stage gets "bumped up" by a category. You can see that in the plots below, which show climbs as categorized by the organizers of the Tour de France itself for the 2012, 2007, 2005, and 2004 editions of the Tour, and plotted by the length of the climb and its average gradient. If given the length of the climb and gradient, you can calculate the total elevation change for that climb, and the dotted contour lines in each plot show that. Cat 2, 1, and HC climbs are named. For example, in 2004 the Vilard de Lans climb was classified at a Cat 2 climb rather than (evidently) a Cat 3 because it was the end of the stage. Similarly, in 2005 the climb to Pla d'Adet ended the stage, and it appears that its category was also increased from (arguably) Cat 1 to HC.
As an aside, the Madeleine was climbed in both 2004 and 2005 but, as you can see, the length and gradient of the climbs were different in those years. In 2004, the Madeleine was climbed from the southern side; in 2005 and 2012, the approach to the Madeleine was from the north.


-
6When I started to behold this answer, I already (correctly) suspected who was its author... Very, very nice work! Commented Nov 7, 2012 at 15:59
-
1
-
I used the official TdF website for the name of each climb, its category, length, and gradient. Given those data, it's simple to calculate the elevation contours.– R. ChungCommented Nov 19, 2013 at 3:25
-
I saw this answer now that the question became active again. It appears that the y-axes represent the average gradient of the climbs. This raises a question for me: climbs do vary in gradient. I wonder how that plays into the subjective classifications. Naively, I'd expect a climb that varies a lot in gradient over its length to be harder than one that varies less. I'd also guess that steeper gradient at the start and easier at the finish would be easier than the reverse. That's not a criticism of this particular answer, as it applies generally (if I'm right) Commented Jan 7, 2021 at 16:57
-
@WeiwenNg Yes, those are avg gradients, as reported by the official TdF site. As you can see from the 2005 and 2007 Tours, Roselend is rated "low" relative to its total rise, while Iseran is rated HC. That's both because Roselend is a fairly steady climb while Iseran is a bit more uneven, and also that the start of the Iseran is already at altitude and the top is very high. So total rise and placement in the stage isn't the whole story.– R. ChungCommented Jan 7, 2021 at 17:40
I prefer the cycling lore that it was decided by which gear of a Citroen 2CV you needed to be in to drive up the hill/mountain. For HC climbs you had to go up them in reverse.
Scientific? Not so much. Perceived Gallic? Mais oui!
For Strava climbs there is an objective categorization that is length in meters times grade in percent, with this categories:
score = length(m) * grade(%)
- Cat 4: score > 8000
- Cat 3: score > 16000
- Cat 2: score > 32000
- Cat 1: score > 64000
- Cat HC: score > 80000
For example Alpe d'Huez has a length of 13800m and average gradient of 8.1% (according to Wikipedia), giving a score of 111780, which would place it as a HC climb since its score is way above 80000.
The tour organizers rank them subjectively based on their steepness, length, and also where they occur in the stage (climbs near the finish garner a higher ranking). Another criterion which seldom makes a big difference is road condition. Some people feel that the ratings have been inconsistent over the years, or have been inflated in recent years. In short, there is no scientific way of rating the climbs, it's just a judgement call from the race organizers.
Note, others have indeed tried to quantitatively rank the climbs. You could apply their methodology to climbs near where you live to figure out how a local climb might be ranked at the end of a tour stage.
-
Great link to podium cafe! I can't wait to run their formula on some of my favorite, and not so favorite, climbs.– user313Commented Sep 26, 2010 at 19:59
Another important criteria is where the climb is placed. If you put an otherwise cat 1 climb at the end of a mountain stage with an uphill finish, it becomes an HC climb.
I was told by Doug Dailey (a club cycling colleague and long ago British champion, British Cycling legend), that the categories were historical, and based on early Citroen capabilities (1920’s ?). If said car could only go up a hill in 1st gear, it was defined as category 1. If it could do it in second, category 2, etc. Sounds plausible and very French. J
-
...and for hors categorie, the Citroen 2CV could not survive it and you need a horse. That part doesn't sound like it would work as well in French :)– ojsCommented Jul 25, 2018 at 21:12
-
So a 2CV can get up the Mur de Bretagne (2.2km at 6.5%) in third gear? Commented Jul 25, 2018 at 22:36
-
Also, this claim has alread been posted in an earlier answer. Commented Jul 25, 2018 at 22:42
from the graphs you could derive a single formula which would be rougly
Category = 10.5 - log2 (Grade x Distance)
(where HC = 0)
for example for Alpe d'Huez it's 12 km or 12000 m at 8% or 0.08, so: cat = 10.5 - log2(0.08 * 12000) = 10.5 - log(960) = 10.5 - 9.9 = 0.6 which seems fairly accurate (so tougher than cat 1)
-
1Do you have any sources backing up that this is actually how the decision is made?– ojsCommented Jul 4, 2021 at 11:19
-
1As noted in a comment on a previous answer, distance * grade is just the total height of the climb, and there are numerous examples where 2 different climbs of the same total height have different classifications.– DavidWCommented Jul 5, 2021 at 14:45
@pablete mentioned the Strava Climbs with the formular:
score = distance(m) * grade(%)
This score can be easily boiled down to just the rise in meters because
grade = rise / distance * 100
which means the Strava score is basically this:
score = distance * rise / distance * 100
After simplifying this becomes:
score = rise * 100
Oh! So this is just a very subjective and inaccurate categorization of total rise without any reference point.
In my opinion the Strava categorization is completely useless.
-
1This is just a rant, not answer. The categorization consists of two points. The total elevation gained and the minimum average gradient necessary. It must be a continuous climb, otherwise you don't get the required minimal gradient. Commented Jan 6, 2021 at 13:26
-
Why is this a rant? True it is not a direct answer. But due to my low reputation points I couldn't answer to @pablet directly, so I posted it here. You explanation though still makes no difference to the result. Your minimal gradient is just a threshold, but the formular
score = risebasically remains the same. Commented Jan 6, 2021 at 14:17 -
But as the answer by R.Chung nicely shows, the rise corresponds to the categories used in real races quite well. It can never perfectly copy the TdF categorization because some climbs even change their categorization from year to year. Commented Jan 6, 2021 at 14:47
-
Sorry, but the graphs from R.Chung only showing this:
The more _rise_ you have made, the higher the category.Grade is derived from rise and distance. So, when you made a climb/rise of 500m you are in category 2, when you made a rise of 1000m your are in HC already. Try it out. You can calculate the grade from the rise withgrade = (rise / distance) * 100. Then you can put it in the Strava formularscore = distance * grade. With the score you can get the category from a mapping. cat4 > 8000, cat3 > 16000, cat2 > 32000, cat1 > 64000, hc > 80000 according to Strava. Commented Jan 6, 2021 at 15:12 -
That is what I am saying, the more rise, the bigger the category. Even in real TdF. Therefore Strava categories are good and far from "useless". Commented Jan 6, 2021 at 16:06
