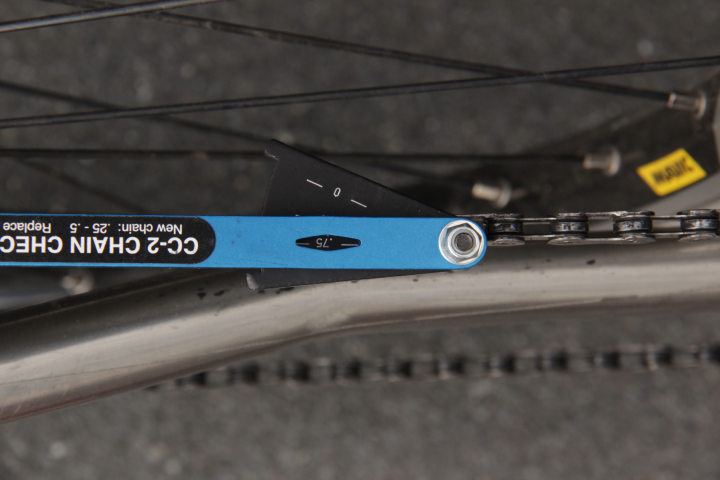
Your high CC-2 reading likely relates to how much pressure are applying. The CC-2 device is not particularly solid and its readings are sensitive to how much pressure you apply to the pivoting gauge.
From the manual:
Instructions
- Set pivoting gauge so “0” is visible in viewing window.
- Lower CC-2 so fixed pin rests between chain’s inner plates.
- Lightly push pivoting gauge just until it stops. Forcing gauge will damage the CC-2’s pins, resulting in inaccurate measurements.
I also have moved to measuring chain stretch via Vernier calipers, however my approach differs from yours as I try to mimic the cc-2 type inner measurement but with more precision (see below for methods). According to my calibration chart your L1 measurement suggests a chain stretch of 0.4%, which seems like a lot for 600 km, but not impossible. I would try repeating your L1 measurement a couple more times to be sure. Either way, you will likely need to change your chain soon.
Using Vernier Calipers To Measure Chain Stretch
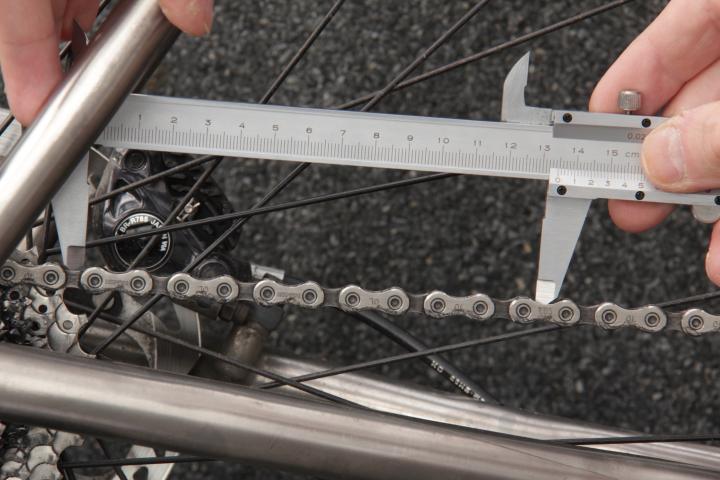
Because you are also attempting to use Vernier calipers to estimate chain wear I thought I would share a method I derived for using Vernier calipers. I decided to follow the same method as the Park tools (inner measurement - your L1 approach - for 10 links) as I wanted to include wear on the bushings (as this is what the cog interacts with). As many have pointed out there is no perfect way to measure chain elongation.
I have, over the years, struggled with this question, consulted with tool brands on the designs of chain-wear indicators, and have measured innumerable chains with many different methods. I have yet to come up with a definitive way to do it. I have ended up choosing one chain checker that I found to be the easiest to use, and I use it frequently and try to figure out its idiosyncrasies to ensure first and foremost that I replace my chain soon enough that it doesn’t fry my cogs, and secondly that I don’t replace chains too soon and throw good money down the drain by disposing of perfectly good chains.
-- Lennard Zinn, Technical FAQ: Chain wear measurement
So my approach has been to take an approach and improve the precision so that I could use it to do things such as estimate chain wear rates and predict service dates.
 Example of an inner link measurement (10 links apart)
I settled on your inner measurement approach (pictured above) and calibrate my Vernier calipers against a CC-2 device, so I could translate a linear measurement into an approximate % wear. I did this by creating a calibration regression chart converting the Vernier L1 measurement to a stretch percentage (see below). I figured that while the CC-2 can be difficult to use consistently, it should at least be generally accurate. Note that my calibration measurements involved only a very light push on the CC-2 gauge.
Calibration
I repeated three measurements of the CC-2 gauge at the 0%, 0.25%, 0.5%, 0.75% and 1% gauge readings. I then took the average and did a simple linear regression against the gauge readings (below).
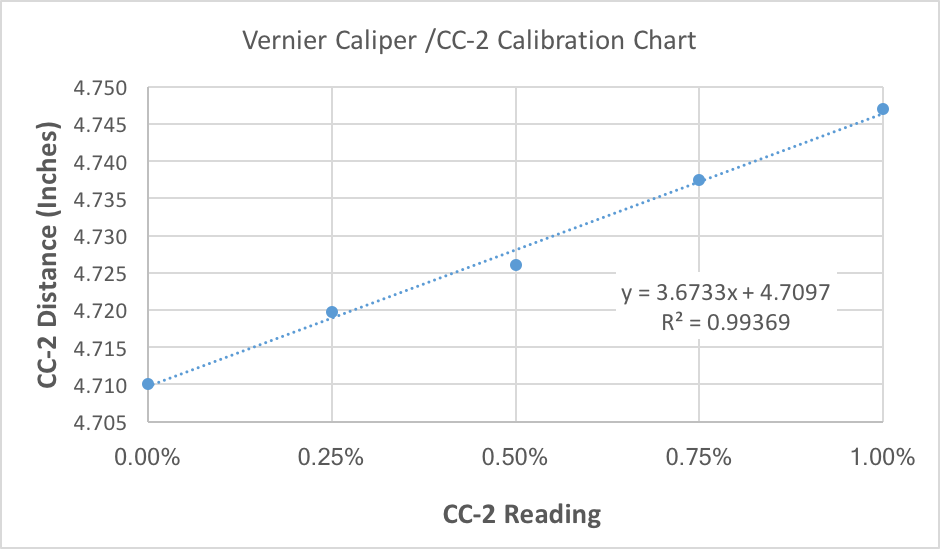
The regression estimates were then used to create the following reference table:
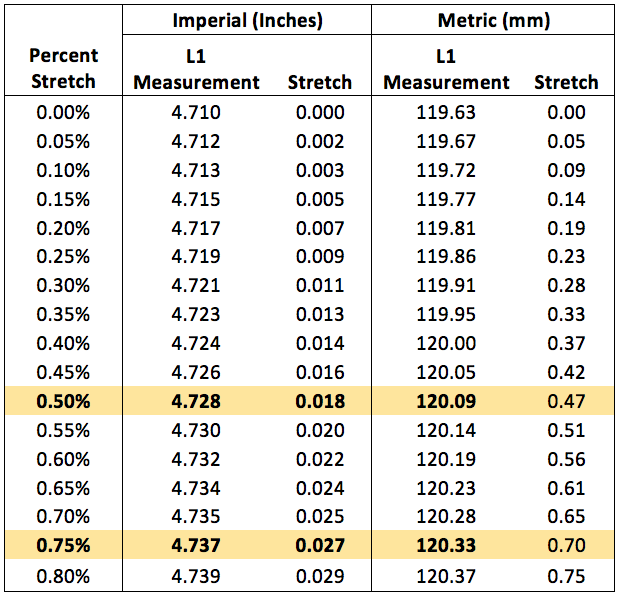
I believe this is a reasonably decent calibration chart as I hit 0.5% or 0.75% on the chart, the other Park Tool CC-3.2 pass/fail gauge nicely slides in at the 0.5% and 0.75% sides respectively. The conversion table is of course not perfect as some chains came with an initial stretch measurement less than 0% (i.e., the CC-2 gauge would not fit in place). As such, 0% does not represent true zero. That said, we are really interested in the 0.5% or 0.75% wear, which the chart seems to approximate well (for how Park Tools measures chain wear).
As you can see your measurement of 120mm suggests 0.4% stretch. Typically I will measure the chain with Vernier calipers in three random places and take an average, then compare against the chart. I also record these measurements and regress them against the current distance or duration to get a better estimate of the current wear rate, as well as projecting service intervals.
Predicting Service Life
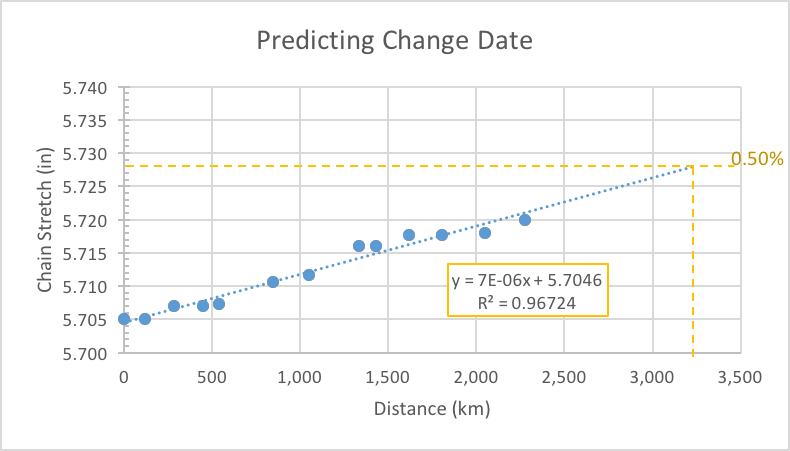
I typically take periodic measurements over the course of the chain life in order to predict my Service date. Below is an example for a KMC X11-SL chain. As you can see it will be time to change the chain at about 3,250 km. Given how much wear you have observed in 600 km you may wish to reconsider your maintenance regime or chain brand.
Wear Rates by Product Tier
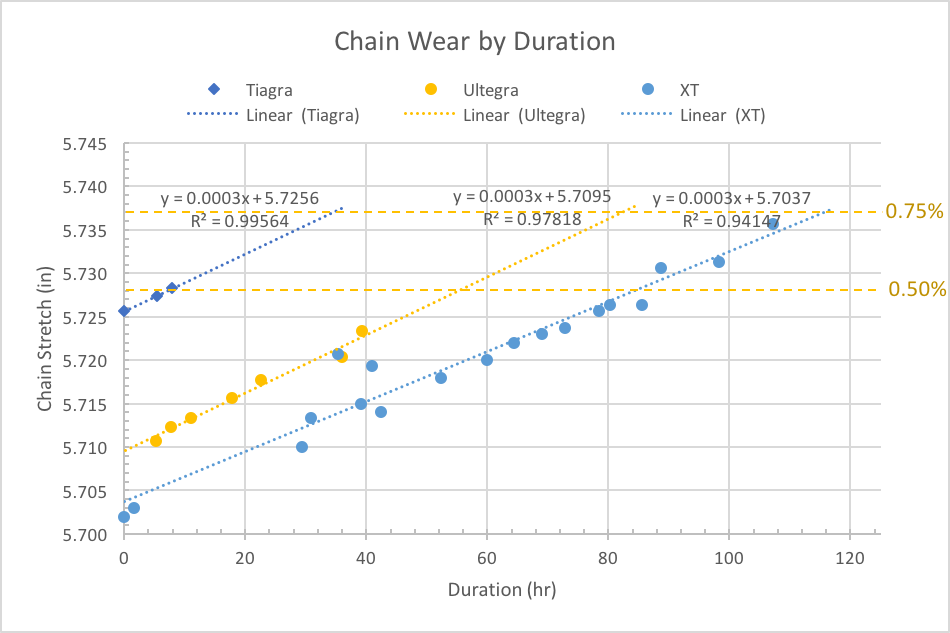
You can also use this approach to compare the performance of different product tiers within a chain brand or even between brands. Below is an example of 10 speed Shimano chains: Tiagra vs Ultegra vs XT. Note I use duration as chains are on different bikes that travel at very different average rates of speed so I didn't think standardizing against distance would give an apples-to-apples comparison. All three give the same wear rate estimate (slope of 0.0003) which suggests this a sensible comparison approach.
The XT chain was run on a gravel bike and was in dusty conditions for most of the time. The ultegra chain was run in clean road conditions and the Tiagra on dirt (similar to the XT). More recent XT chains (not displayed) seem to have the same initial reading as the Ultegra chain so I may have lucked out with the XT chain in the plot.
It is scary how bad the Tiagra chain is, out of the box it's stretch measurement is nearly 0.5% and I would be surprised if I get 40 hours of riding out of it (less than a month commuting) if I wait to 0.75% before I change.
All three product tiers have the same wear rate (slope), but it would seem that Shimano's strategy is to have the lower priced tiers have a worse starting point so that their life is shorter. If the lower tiers (e.g., Tiagra) had a tighter tolerance chain life would have been the same as the higher product tier, despite being constructed with "lower quality" materials as suggested by the marketing department.
