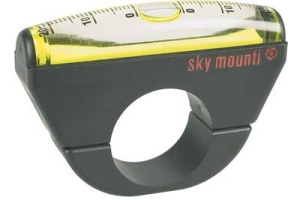
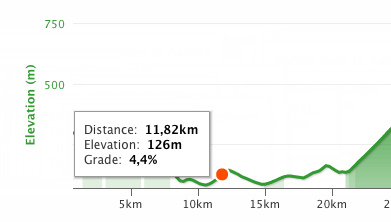
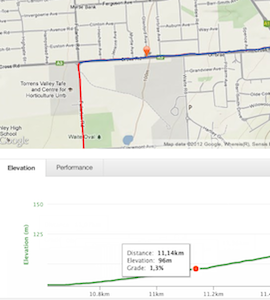
Others have already discussed GPS and GPS-enabled phones, altimetric barometers, and inclinometers. Bubble inclinometers (such as the Skymounti shown elsewhere among the answers) can be affected by acclerations so to get the best readings you should be stationary. dGPS (differential GPS) is used in surveying instruments to measure grades, but these are generally not consumer-level devices, nor are they compact enough for bicycle use. Grades can also be measured, while stopped, with a long straightedge, a protractor, and a plumb line. Some phones and other devices (such as iPods and Wii controllers) have built-in multi-axis accelerometers that will report gradient information as you ride, but reports are that their precision can be affected by bumpy roads. The iBike line of bicycle computers use a combination of barometric, speed, and accelerometer sensors; reportedly, the gradient estimates can be quite good.
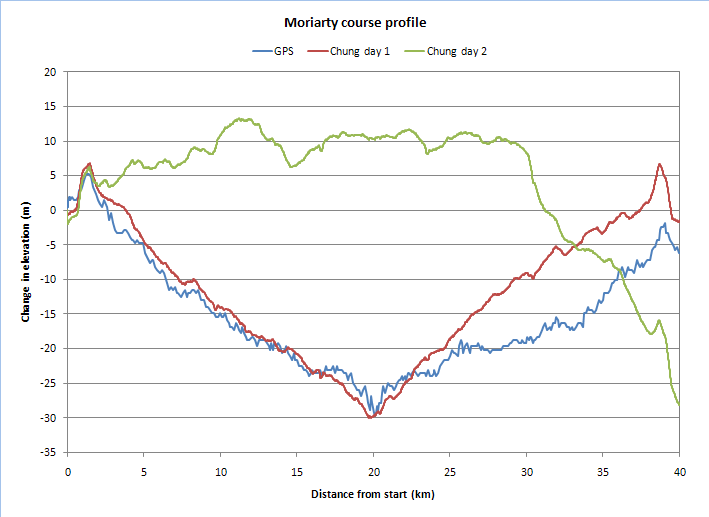
That said, one of the most precise devices that can be used to determine road grade while on a bicycle is a well-calibrated power meter. Under favorable conditions, road grade can be extracted from speed and power data (if one knows or can measure a few other variables). For example, here is a comparison of the profile of the flat Moriarty, New Mexico, TT course on which the 40 km US national time trial record was set. The course is a straight out-and-back (that is, 20km out, a turn-around, and then 20km back for a total of 40km) and one of the flattest in the country, with only 30 meters of drop over 20km for an average gradient of .0015 (0.15%). The plot below shows three traces: a measurement of the gradient using a consumer-level GPS receiver in blue, and two traces (in red and green) derived from power meter measurements. The green line shows the reconstructed elevation profile on a day with unfavorable conditions, while the red line shows the reconstructed profile on a favorable day. Because this course is an out-and-back, the profiles before and after the 20km point should be mirror images, and at the end should match up at the same elevation. As can be seen, under favorable conditions the profile reconstructed from the power meter outperforms that from a GPS (though on an unfavorable day the profile is much worse).
For another example, here is the reconstructed elevation profile for a multi-use path along the shore of San Francisco Bay.
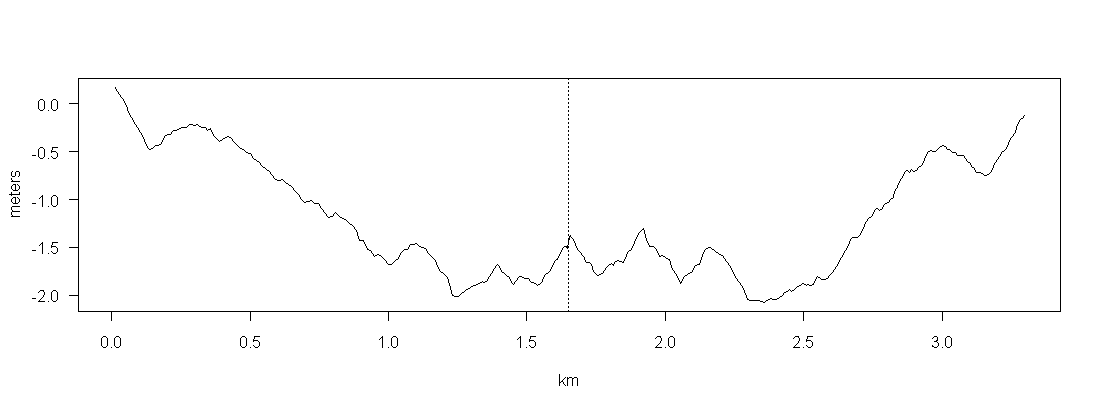
This shows the profile over a 1 mile (=1.6 km) out-and-back segment of the trail. Once again, you can see that the two halves of the reconstructed profile are mirror images, and the average slope was about .00125. Just as importantly, you can easily spot consistent dips in the trail of less than 40 cm (about a foot).
The description of the analytical method used for these two plots and the additional data required is given here.

