73

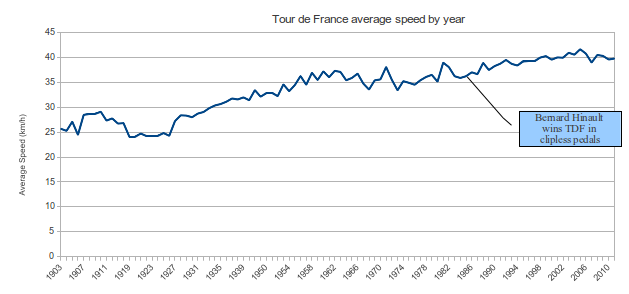
I was having a look at the average speeds of the winner of the Tour de France over the years on this page. To help things along I put the data into LibreOffice and produced a plot:

Tour de France average speeds

I put on the chart where clipless pedals came in, and I suppose the switch to carbon framed bicycles came in a few years after that (not sure exactly when). What really struck me though was that the average speeds really haven't changed much, especially in the last few years.

There was a big jump in the late 80's/early 90's, some of which could be attributed to the doping practices of the time, but not all of it. Doping of some form or another has been going on since the beginning of the TdF.

It seems really odd to me that given:

  • improved training
  • improved nutrition
  • improved technology

there is only roughly a 10% increase in speed since the 1960s and virtually none in the last decade.

Are we being defrauded by companies trying to sell us all sorts of products (carbon whatnots and sugary goo!)?

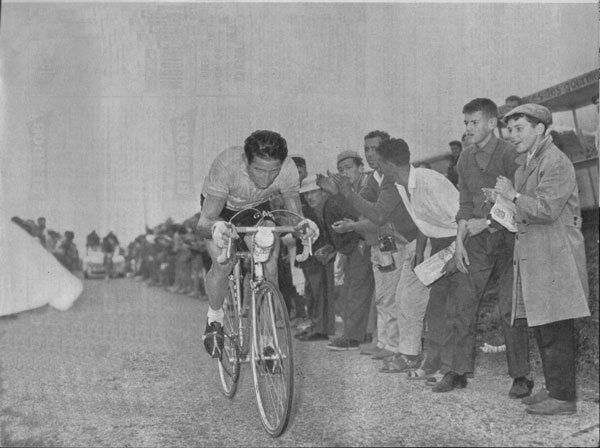
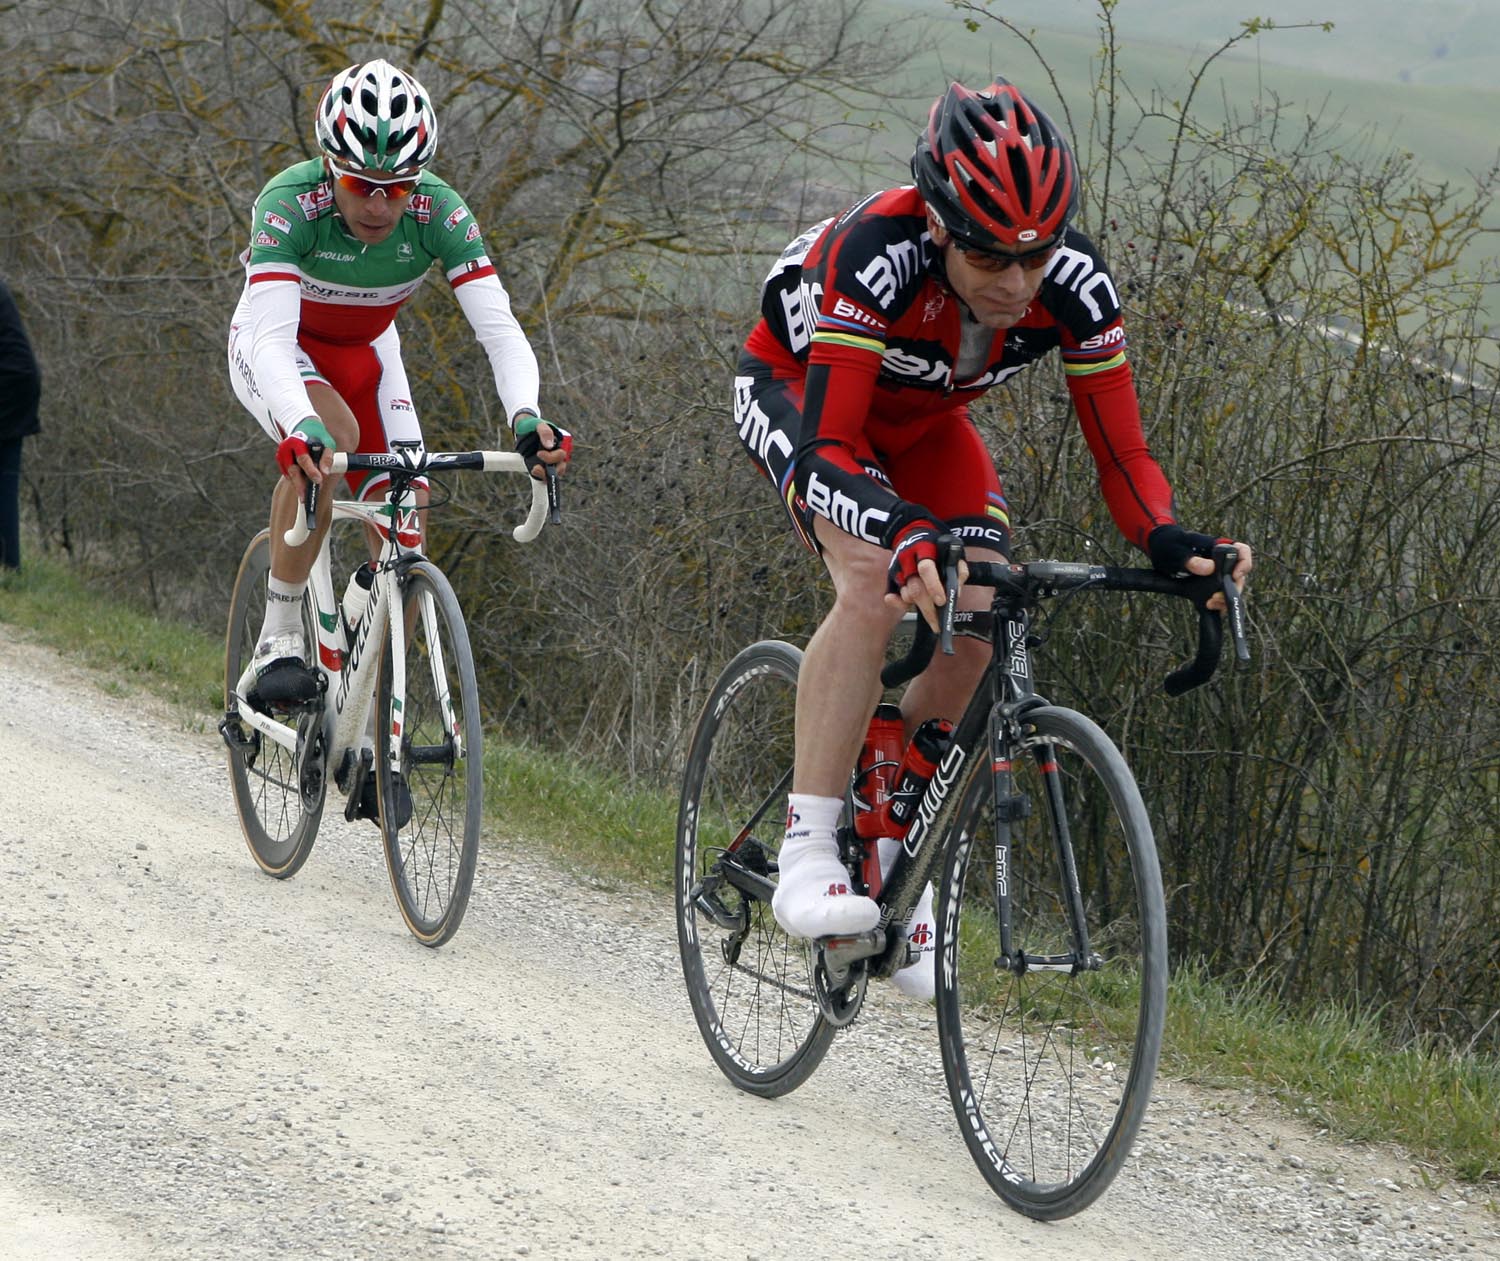
Gastone Nencini (1960)Cadel Evans (2011)

20
  • 8
    Just a simple question to add: are the TdF comparable? I mean, I seem to remember hearing/reading that there were more and more hard mountain days in latest editions. Is that true? Maybe that could account for some limitation on the average speed.
    – jv42
    Commented Jan 13, 2012 at 15:08
  • 5
    @jv42 this is a fair point, except that earlier editions of the tour were disproportionately harder! For example in 1919 (the slowest tour) the total distance was 5560km, compared to 3430km last year, and although I don't have stats on how much climbing they've done each year I don't think it's changed a lot since they introduced the mountains. Also note that rest days were only introduced in the late 60's
    – tdc
    Commented Jan 13, 2012 at 15:20
  • 6
    It might be interesting to see where on that graph the race radio was popularized. Commented Jan 13, 2012 at 18:39
  • 8
    You might want to find a copy of Bicycle Quarterly vol. 8 no. 4 where an interesting analysis is done of bicycle race speeds compared with foot racing; there is a high correlation and some of the performance increases are due purely to improved training and simply better athletes in the competition. One surprising result: even introducing the derailleur didn't make a massive spike in performance.
    – lantius
    Commented Jan 13, 2012 at 23:53
  • 7
    @tdc "How did they go so blinking fast in 1960!?" Drugs, and lots of 'em of course.
    – stib
    Commented Jan 19, 2015 at 12:52

27 Answers 27

67

What really struck me though was that the average speeds really haven't changed much

The chart ranges from about 25km/h to over 40km/h, and that is a big change. As others have mentioned, increasing your average speed requires a non-linear increase in power applied to the pedals.

In other words, to increase average speed from 25km/h to 26km/h is easier than increasing from 40km/h to 41km/h

Say I were to steal a time-machine, go back and ride each TdF course, using the exact same bike. To match the winners average speed, this is the wattage I would need to produce (well, a very crude approximation):
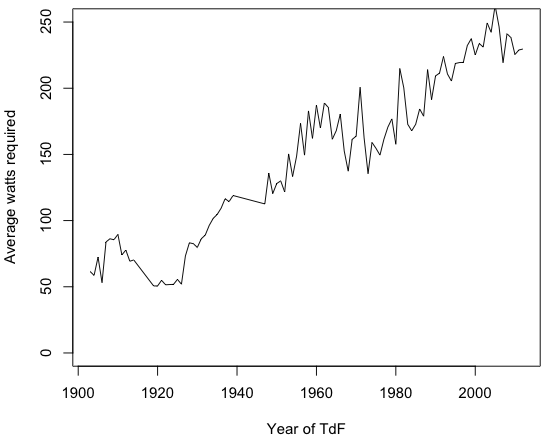
Wattage required to match TdF winner each year

(again, this is a very crudely approximated graph, designed to illustrate a point! It ignores stuff like wind, terrain, drafting, coasting, road surface and many other things)

From around 60 watts to 240 watts is a huge change, and it's very unlikely that TdF competitors have increased their wattage this much over time..

Part of the increase will be due to more powerful cyclists (thanks to better training and nutrition), but certainly not all of it.

The rest is likely due to technological improvements. For example, a more aerodynamic bike will decrease the power required for a given average speed, same with a lighter bike when going up hills.


Source for graph: Although my point should remain valid regardless of how inaccurate the above graph is, here is the messy script I used to generate it

It uses the data from here, exported to CSV (from this document)

The average speed to required watts calculation could be simplified greatly, but it was easier for me to just modify the script from my answer here!

#!/usr/bin/env python2
"""Wattage required to match pace of TdF over the years

Written in Python 2.7
"""


def Cd(desc):
    """Coefficient of drag

    Coefficient of drag is a dimensionless number that relates an
    objects drag force to its area and speed
    """

    values = {
        "tops": 1.15, # Source: "Bicycling Science" (Wilson, 2004)
        "hoods": 1.0, # Source: "Bicycling Science" (Wilson, 2004)
        "drops": 0.88, # Source: "The effect of crosswinds upon time trials" (Kyle,1991)
        "aerobars": 0.70, # Source: "The effect of crosswinds upon time trials" (Kyle,1991)
        }
    return values[desc]


def A(desc):
    """Frontal area is typically measured in metres squared. A
    typical cyclist presents a frontal area of 0.3 to 0.6 metres
    squared depending on position. Frontal areas of an average
    cyclist riding in different positions are as follows

    http://www.cyclingpowermodels.com/CyclingAerodynamics.aspx
    """

    values = {'tops': 0.632, 'hoods': 0.40, 'drops': 0.32}

    return values[desc]


def airdensity(temp):
    """Air density in kg/m3
    Values are at sea-level (I think..?)

    Values from changing temperature on:
    http://www.wolframalpha.com/input/?i=%28air+density+at+40%C2%B0C%29

    Could calculate this:
    http://en.wikipedia.org/wiki/Density_of_air
    """
    values = {
        0: 1.293,
        10: 1.247,
        20: 1.204,
        30: 1.164,
        40: 1.127,
        }

    return values[temp]


"""
F = CdA p [v^2/2]
where:
F = Aerodynamic drag force in Newtons.
p = Air density in kg/m3 (typically 1.225kg in the "standard atmosphere" at sea level) 
v = Velocity (metres/second). Let's say 10.28 which is 23mph
"""


def required_wattage(speed_m_s):
    """What wattage will the mathematicallytheoretical cyclist need to
    output to travel at a specific speed?
    """

    position = "drops"

    temp = 20 # celcius
    F = Cd(position) * A(position) * airdensity(temp) * ((speed_m_s**2)/2)
    watts = speed_m_s*F
    return watts
    #print "To travel at %sm/s in %s*C requires %.02f watts" % (v, temp, watts)


def get_stages(f):
    import csv
    reader = csv.reader(f)
    headings = next(reader)
    for row in reader:
        info = dict(zip(headings, row))
        yield info


if __name__ == '__main__':
    years, watts = [], []
    import sys
    # tdf_winners.csv downloaded from
    # http://www.guardian.co.uk/news/datablog/2012/jul/23/tour-de-france-winner-list-garin-wiggins
    for stage in get_stages(open("tdf_winners.csv")):
        speed_km_h = float(stage['Average km/h'])
        dist_km = int(stage['Course distance, km'].replace(",", ""))

        dist_m = dist_km * 1000
        speed_m_s = (speed_km_h * 1000)/(60*60)

        watts_req = required_wattage(speed_m_s)
        years.append(stage['Year'])
        watts.append(watts_req)
        #print "%s,%.0f" % (stage['Year'], watts_req)
    print "year = c(%s)" % (", ".join(str(x) for x in years))
    print "watts = c(%s)" % (", ".join(str(x) for x in watts))
    print """plot(x=years, y=watts, type='l', xlab="Year of TdF", ylab="Average watts required", ylim=c(0, 250))"""
5
  • 20
    +1 for proper use of the scientific method and sharing your code Commented Feb 3, 2013 at 12:02
  • 3
    Actually I think this might be hitting the nail on the head. And cudos for submitting code! I've made this the accepted answer.
    – tdc
    Commented Jul 22, 2013 at 13:05
  • 1
    Kinetic energy is 1/2*m*v^2. You mentioned going from 25 to 26 mph is much less energy than going from 45 to 46 but only if the mass is equivalent, which we know it is not. How does this apply when considering bike weight and, especially, wheel weight?
    – jfa
    Commented Nov 24, 2013 at 21:18
  • 6
    Wooo +1 just for the python!
    – Paul H
    Commented Sep 21, 2014 at 5:53
  • 3
    @mbatchkarov It's not really "scientific method", I'm afraid; that term has quite a specific meaning. Commented Sep 29, 2016 at 7:20
87
+100

The simplest answer to your question is that 1) speeds have increased; but 2) speeds would have increased even more except Tour organizers have been consciously making the Tour harder in order to increase the drama, suspense, and entertainment value of the race. That makes comparisons of overall winner's speed quite complex when combined with normal variations in wind, weather, and team tactics during the race.

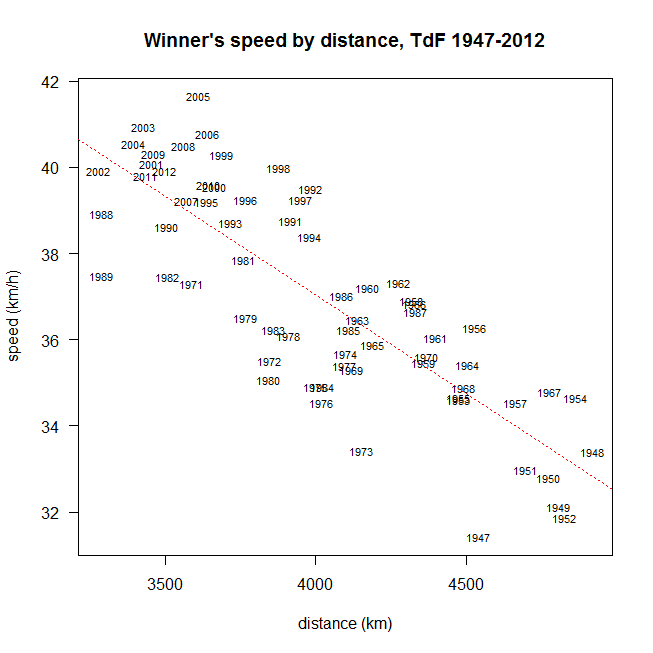
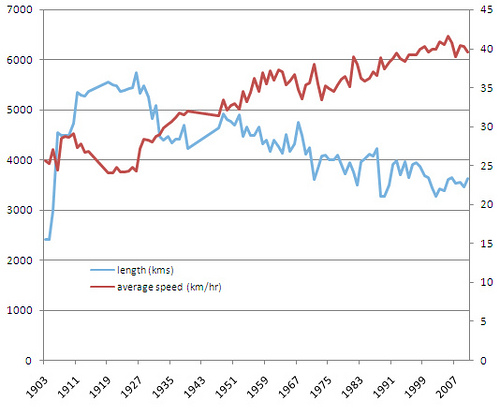
First, some historical background. Over time, the winner's average speed in the Tour has indeed increased, especially in the period of the early 1990's and some (including, for a famous example, Greg Lemond, himself a three-time winner of the Tour) have claimed that this is evidence of doping behavior in professional cycling. However, as one of the other answers showed, there is a strong relationship between distance and overall winner's speed. Here is a plot that shows that relationship in the post-WWII period through 2012:

speed by distance, TdF 1947-2012

The distance of the Tour has been decreasing due to the rules and regulations of the UCI (the Union Cycliste Internationale), which negotiated a limitation to the length of races and mandated certain numbers of rest days during the Tour with the Professional Riders' Association. From an historical perspective, these limitation were a response to charges that the difficulty of the Tour resulted in riders needing to dope simply to survive, and that by "easing" the stages and inserting rest days there would be less need to dope.

An effect of shorter stages (and higher speeds), perhaps paradoxically, is that race organizers have been increasing the difficulty of the stages; this is particularly noticeable in the other two "Grand Tours", the Giro d'Italia and the Vuelta a Espana but also applies to the Tour: the number and "spacing" of categorized climbs in the Tour has resulted in more difficulty overall. Each year, at the announcements of the routes for each of the Grand Tours, riders and analysts pronounce whether a particular parcours will be relatively difficult or relatively easy, and favoring either sprinters, time trialists, or climbers. That there is a still a strong relationship between length of the Tour and overall speed simply means that the organizers haven't completely compensated for the distance effect with increased difficulty.

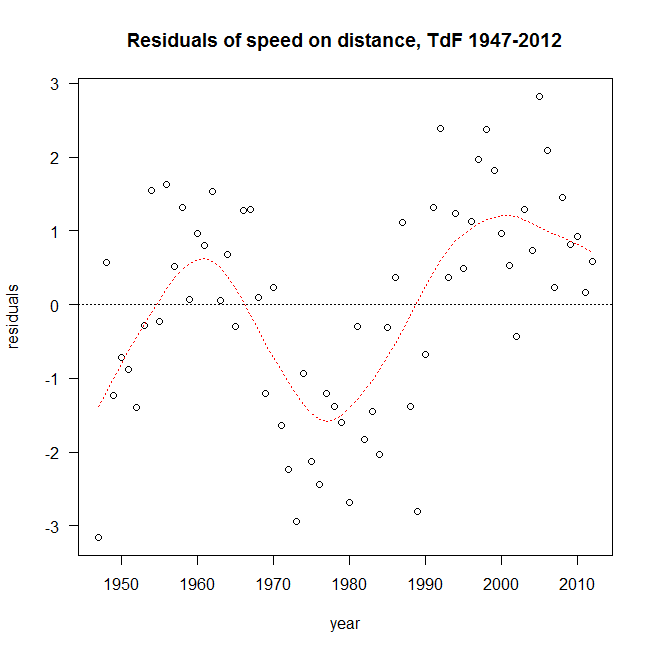
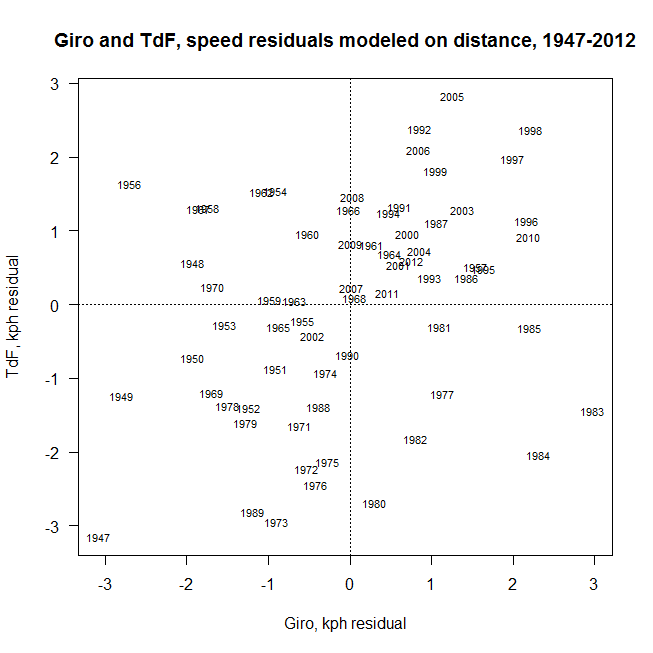
And, although your question was not expressly about doping behavior in the pro peloton, a bit more must be said about that. The plot above shows a clear relationship between distance and speed but there is still a question about deviations (or the "residuals") from that relationship. That is, after removing the effect for the length of each Tour, what is the remaining trend in the winner's average speed? The plot below shows that trend with a dotted red line.

time trend in residuals from speed on distance

As you can see, the winners' average speeds in the 1970's and 1980's were below trend, while speeds in the 1960's, 1990's and 2000's were above the long-term trend. So, even if the long-term trend in speeds can mostly be explained by Tour length (the correlation between Tour length and winner's speed is about 0.8), some have pointed to this secondary effect in the residuals as further evidence of doping. However, there are two counter-arguments, one slightly weaker and one very much stronger. The weaker argument is based on the observation that the residuals are "double-peaked" and speeds in the 1960's were also higher than the trend, then dropped in the 1970's and 1980's. If doping were the simple explanation, one would have to explain the drop in the 1970's and 1980's, not just the rise in the 1990's and 2000's. However, the stronger argument is based on examining data from other races and comparing them to the Tour. If one were to examine the residuals from a similar plot of speed vs. distance for the Giro and Vuelta, one would see that the years when their speeds were above (or below) their own trend lines did not correspond with the same years for the Tour. That is, the speed residual for the Tour and the speed residuals for the Giro or Vuelta are not "synchronized." Thus, if doping behavior explained the reason why Tour speeds were higher than would be predicted from distance, then one would have to explain why doping behavior was different in the Tour and Giro (or Vuelta) in the same year, often with the same riders. Below I include a plot that shows the "residuals" from the Tour (that is, residuals from the regression of winner's average speed on Tour length) plotted against the same residuals for the Giro. This does not mean, of course, that there is no doping in either the Tour or the Giro -- it simply means that one cannot use average speeds as evidence of that doping. Conversely, it also means that one cannot use doping as an explanation for increased average speed. Taken together, it does support the evidence that race organizers's decisions about the routes is a main determinant of the average speed.

speed on distance resids for TdF and Giro

2
  • 3
    Fantastic answer! Although the statement "That there is a still a strong relationship between length of the Tour and overall speed simply means that the organizers haven't completely compensated for the distance effect with increased difficulty" is perhaps a little strong, as it implies that the distance effect is the main effect at work here? But overall, the flavour of this seems to be that once you factor out race distance, all of the technology etc has made even less difference! Wouldn't it be great to send them all out on 60's bikes and see what happens!
    – tdc
    Commented Jan 24, 2012 at 10:02
  • Can you produce a plot of the residual with time after distance has been factored out? Some bounty will wing it's way over if you can ;-)
    – tdc
    Commented Jan 25, 2012 at 12:13
47

There are a few "pseudo-facts" I think might be at play in this graphic:

  • You mentioned 10% of increase, say from 35km/h to 40km/h average speed. That is a VERY significant increase. Anyone well trained can sustain 35km/h average for some time even in a mountain bike, but FORTY km/h is MUCH HARDER to sustain, and that's because aerodynamic drag is proportional to the SQUARE of speed. So, 35 squared is 1225. 40 squared is 1600. The effort, then increases more than THIRTY per cent! (I am always startled with this...).

  • Also, like Daniel R Hicks mentioned, despite training and technology, our genes are still the same. Muscle power and speed, as well as cardio, lungs, blood vessels and biomechanics are preset within a range that cannot be easily changed. I wonder what would happen if they built a bike for horses to ride (biker is faster than horse (?) which is faster than human on foot - what about a horse on a bike?)

  • Lastly, even with modern bikes being so light and efficient, older bikes (say, from 70's to the present) are already light and efficient. If you take a 15kg bike and make it half the weight, it's 7kg less. For a biker with 70kg, that is 10% of total weight. But then I wonder again: if you always train with a heavy bike, do you get stronger than a guy who trains with a featherlight bike? Do modern athletes train with heavy bikes in order to be stronger, and take advantage of this when they have the featherlight bike during the race?

Well that's what comes to my mind, I'm eager to hear more competent and knowledge-based answers (not these somewhat wild guesses).

Good question!

7
  • Agree with the first point (the cube law of resistance) to a degree. However it's missing the fact that the overall leader (who's time we're looking at) will spend a huge amount of time in the bunch or surrounded by teammates, or otherwise climbing where air resistance is less of a factor. In fact since team tactics have become so important, I would say that this should be the case now more than ever! As for the second point, yes this is true to an extent, but in the 60's they really had no idea about training routines (build/taper phases etc), or correct nutrition (steak for breakfast???)
    – tdc
    Commented Jan 13, 2012 at 13:21
  • 1
    The last point is interesting, but sure it's not just weight: what about tyre technology, better brakes (for the downhills), clipless pedals, carbon semi-aero rims, super light climbing wheels, carbon-soled shoes, aero-tubing on bike frames, concealed cables etc etc etc. And not to mention better (smoother) roads!
    – tdc
    Commented Jan 13, 2012 at 13:26
  • 2
    Tire technology hasn't really reduced rolling resistance — it's already about as low as is practically possible. Commented Jan 16, 2012 at 19:59
  • 2
    I'd also argue that given the massive peloton in the TdF, aerodynamic improvements don't have a significant an effect for long stretches of the race. Keep in mind, the 50th place finisher this year was less than 2% off the time of the winner. Aerodynamics are enormous during the (comparatively short) breakaway periods. But not so much for the meat of the race where everyone's bunched together. Commented Jan 16, 2012 at 20:01
  • 2
    Offset by a decline in doping, most likely. Bike technology certainly moves the game forward for components of the TdF (climbs, small breakaway groups, and time trials being obvious candidates), but I'd wager a modern peloton is likely approaching the maximum possible theoretical efficiency. Commented Jan 17, 2012 at 18:46
21

I am not a bike expert, but a computer programmer. The problem with this question is that there is no control to compare it to.

Each year the TDF changes. They visit different parts of Europe, yes it is not 100% in France. This means you can't compare times between years.

Weather (not climate) is a concern. The temperature, wind and humidity will impact the performance of the athletes.

In regular Olympic events, like the 100m dash, there are standards for slope (0 degrees), the angle of the turns, and the condition of the track. In other events like bowling there are standards regarding the amount of oil on a lane. If anything is out of spec on the track or the lane they don't count the time as a record.

Also it is a team event, they even give bonus points for winning parts of stages, it is too complex to compare one year to the next.

Nobody compares the time for the Olympic downhill from one year to the next. Different mountain. Different weather.

2
  • 4
    Reasonable points, but we're not comparing one year to the next, we're looking at trends over decades. And actually the graph is pretty smooth considering all those factors. I would also argue that the overall conditions (weather, course difficulty) tend to average out over 3 weeks to a great extent, so it's not the same as something like the 100m where the wind can mean that average runners break the world record.
    – tdc
    Commented Jan 17, 2012 at 16:31
  • @tdc - It may be true that things like weather may average out over the course of 3 weeks and it could be expected that over a period of decades these may be similar. I don't think that things like this would necessarily apply for things like to things like course length, change in elevation, etc. Commented Jan 25, 2013 at 19:32
19

The Tour de France is primarily an endurance event, where team strategy is more important than outright speed. In addition there are UCI rules for racing bicycles.

This includes a 6.8kg weight restriction that has been in place since 2000.

If you want to compare outright speeds it would be more interesting to look at how the average speed of the time trial stages has changed over the years.

2
  • Not sure if the data on TTs is available, but yes that would be interesting, although I don't think there were TT specialists in the past like there are now (perhaps the TT times of the overall winner would be fair). Regarding the weight, as I put in a comment above I don't see the weight of the bikes as the only factor in the technology, but yes this is probably the main limiter for climbing speed (other than stiffness)
    – tdc
    Commented Jan 13, 2012 at 15:24
  • Like the weight limit, there are many rules which effectively ban other advancements like more aerodynamic water bottles. The UCI have similar rules for track racing, which have made the traditional hour record practically impossible to beat (covered nicely in the documentary about Chris Boardman's final hour-record attempt)
    – dbr
    Commented Jan 31, 2013 at 10:24
15

Last year I plotted average speed versus race distance and there's an incredibly accurate inverse relationship.

Chart

http:///www.32sixteen.com/2011/07/25/correlation-does-not-equal-causality/

But to add to my chart and flesh out the reason I think it hasn't increased so greatly. The Tour is a stage race. The average speed we have presented is the average speed of the winner of the General Classification, or "GC", not based on the fastest times of each stage.

At the start of the Tour the stages are typically flat stages, and are won by the sprinters. During these stages the eventual winner of the GC is generally looking to achieve parity with his main rivals and finish in the bunch. The bunch itself doesn't ride at the fastest average speed it can. It rides along at a "comfortable" pace, unless there is an attack, and will only achieve top speed during the closing kilometres. Each stage of the race is not run at maximum possible speed it would be if the riders expended maximal effort all day.

Once the race enters the mountains the GC contenders will look to maximise their gains over their rivals and move into the top spots fo the race overall. Even so they will typically only attack on the last climb of the day. They may use their lieutenants to try and wear down their rivals during the early parts of the day by sending out attacks. So again, each stage of the race is not run at maximum possible speed it would be if the riders expended maximal effort all day. Furthermore GC contenders will not only judge their efforts for this day, but for the forthcoming days in the mountains. Attack on day 1 in the Alps and you may lose your time gains on day 2 as fresher riders attack you.

If you plotted the average speed of the Tour based on the fastest time of each stage rather than just of the eventual GC winner you'd see a steeper rise, though for the reasonas I give above even this wouldn't be as great a rise as it would be if every stage was raced flat out.

3
  • Nice! Doesn't really answer the question though ... in fact it makes it even more surprising that they went so fast 50 years ago (or aren't going faster now)!
    – tdc
    Commented Jan 20, 2012 at 14:42
  • So, why does the distance keep going down? Commented Jan 20, 2012 at 22:18
  • The race distance is decided by the Tour organisers, Amaury Sports Organisation.
    – nick3216
    Commented Jan 22, 2012 at 10:39
8

This question makes a category mistake, I reckon. In that the Tour de France is not a competition done to finish an enormous amounts of kilometers as fast as possible -- as would be the case with a marathon for runners; where they athletes do indeed go faster and faster. The only aim the winner of the Tour has, is to be faster than the number two in the GC. And that difference hardly ever is as big as it could be, but far more a calculated difference.

Champions may want to win all the time. Champions, in cycling, are not necessary out to humiliate their opponents. Cycling is a professional sport. Cyclists meet each other all the time.

What a better question would be, is to take not just the average speech of the winner, but the average speed of the first thirty finishers. No doubt that graph will be different.

5

As others have pointed out, The TdF is an endurance race. It's not about all out speed. For a better idea of how bike technology has increased, check out the list of Hour record holders. This is done on an indoor velodrome, with no other people on the track to the person can't draft. The premise is to ride as far as you can in a single hour. The original record listed was only 26 KM, In 1993 the record was only 52 KM. Now the current hour record is 91 KM. That's quite a jump.

5
  • Err I think you want to look at this video of the 2009 record ... not really a bike is it?
    – tdc
    Commented Jan 13, 2012 at 16:19
  • Well, it has 2 wheels, and is fully human powered. Graeme Obree got a lot of criticism back in the day and they actually changed the rules because they didn't like the fact that we won it on an unconventional bike (scotlandforvisitors.com/nmspic.php). If you look at the UCI best human effort. It still shows quite an increase, up to 56 km in 1996. No record has been broken by then. Which is quite surprising, but I guess most athletes would rather focus on beating the non-conventional bike record than trying to beat the old record using conventional bikes.
    – Kibbee
    Commented Jan 13, 2012 at 16:49
  • @Kibbee I think each age has its motivations. For example, there haven't been too much manned landings on Moon, lately. I think professional athletes go for what is most professionally attractive in each moment of history. Commented Jan 13, 2012 at 18:43
  • The tour de france is as much about strategy, speed and timing as it is about raw endurance. Moreover, the race is composed of stages, winning any one of them is the achievement of a lifetime. The GC's deservedly get accolades, but that's still only part of race.
    – Angelo
    Commented Jan 16, 2012 at 19:29
  • 1
    Ah, the current UCI hour record that you linked to is still under 60km. It's the human powered record that is 90km, not the UCI faux-class racing one.
    – Nuі
    Commented Oct 3, 2016 at 0:17
5

Two things that must be considered when looking at the average speeds of the Tour de France are strategy and racing dynamics before you look at the numbers.

The main strategy objective for any of the teams in the Tour is to go only as fast as you must to achieve a given objective while doing the least amount of work possible. If teams could win the tour averaging 23 mph or by not doing any work at the front of the peloton they would, but that is never the case.

In the flat stages you don't see many breakaways and the peloton generally stays together the entire race with many different teams sharing the work load at the front. None of those teams are going to really push the pace (why would they?) unless they want to protect their sprinter or get them in position for the sprint.

In the stages with significant climbs you will often see a breakaway of four to eight riders get separation from the peloton. Now, depending on how long the breakaway stays away, the breakaway is determining the average speed of the stage. If everybody in the peloton is sharing the workload individual riders would barely notice a change in pace from 40 to 42 km/h, while it is a tall task to ask four to eight riders to pick up the pace by the same amount. So the question is who is going to do the work to catch the breakaway? Usually it is the team with the rider in the yellow jacket, and they are going to work as hard as they must to catch the breakaway, and then they will slow down to save energy because others riders will continually be challenging them.

To sum up, a team's objective is not to average a high speed, but to achieve an given objective without doing a large amount of work. On flat stages sprinters are going to suck wheel and out sprint every one to the finish, so 90% of the peloton will not do any work the entire stage, while on mountain stages the average pace is generally dictated by the strength of a breakaway. If the breakaway is caught the pace promptly slows down.

4

Besides all technical aspects race speed is also a question of racing strategy. As long as there is no escape group no team might feel responsible for making pace, so the peleton might ride "slowly".

Once there's an escape group the peleton might decide to keep some distance so they can catch up later, while the escapers might safe energy for a final sprint and just keep "enough" distance to the peleton. A relatively new technology - radio for riders - makes this possible. Nowadays there's quite some control and decision via radio being made ...

If you look at the speed of TdF riders I'd look at the time from time trials or specific mountain climbs.

2
  • There is some truth in this. However from watching the tour over the years, I can only remember a few stages where there was not a breakaway. And sure, the peloton keeps them at arms length, but it always seems like the breakaway riders are giving everything, so the overall speed should be higher. Do you know when race radio came in?
    – tdc
    Commented Jan 19, 2012 at 7:06
  • The second fastest time trial ever was back in 1989.
    – nick3216
    Commented Jan 20, 2012 at 21:49
3

Amongst the other factors, the TDF is an outdoor event and therefore subject to climate change. A few kph change in average wind speeds can cause a few kph difference in the achieved average speeds.

It is known that wind speeds have been rising by 5-10% over the last quarter-century (thanks to Colin Pickard for the link), and France's climate is dominated by westerly winds from the Atlantic. Therefore, the generally faster winds on the Atlantic can be expected to cause faster winds in France and therefore more wind resistance for the cyclists, slowing an upward trend in man and material.

9
  • Surely this averages out ... and isn't all the aero equipment (and I don't even mean on TT bikes - look at the claims Zipp makes for its Firecrest wheels, plus there's tighter fitting clothing) supposed to mitigate the effects of the wind?
    – tdc
    Commented Jan 13, 2012 at 15:43
  • @tdc: At 40 or 50 kph, wind is the one most important opponent of cyclists, no matter how many products claim to mitigate it.
    – thiton
    Commented Jan 13, 2012 at 16:00
  • 4
    +1 - I was sceptical that wind speeds could have changed much in recent decades but a quick google suggests average wind speeds are rising - ocean scientists reckon 5-10% between 1985 and 2008 newscientist.com/article/… Commented Jan 13, 2012 at 16:52
  • @ColinPickard interesting! although whether or not measurements from the oceans can be extrapolated to continental Europe is another question ...
    – tdc
    Commented Jan 17, 2012 at 16:34
  • 2
    @nick3216: Due to the power laws involved in wind resistance, increased tailwind is not nearly as useful as increased headwind, while both are equally likely (well, the TDF has traditionally some more west-east sections, but not enough to reverse the physics).
    – thiton
    Commented Jan 24, 2012 at 17:45
3

As suggested by Anton, here's a look at the Milan-San Remo race that's been using the same (or almost the same) route over the years:

... to give you a better idea of your original question, look at a race like Milan San Remo. Using the same route over all the years. (Or very close to the same route...) There you will see the average speeds have increased all the time over the years. Except the past couple of years it seems to have dropped a little. Maybe because riders are a little cleaner, although I doubt it is that.

Data from BikeRaceInfo:

All Italian racers dream of winning the most prestigious Italian single-day race, Milano-San Remo. It is the longest 1-day race on the pro calendar. Sometimes called La Primavera (Italian for spring) or La Classicisima (the most classic), it is held in mid-March.

Note the y-axis scales do not begin at zero, to make the differences more apparent. The distance has increased slightly over the years somewhat (except 2013 where it was shortened due to heavy snowfall and bad weather).

But the average speed increased in the first half of the 20th century but has levelled off in the 50 years since 1960.

A similar trend can be seen in the 'Five Monuments of Cycling':

1
  • Useful info ... but you're sort of just saying what I said in the question! What are your conclusions?
    – tdc
    Commented Jul 22, 2013 at 13:03
2

Also worthy of note, the riders are still human - maybe they SEEM super human, but i promise they are still human. So at the end of the day, humans have limits, TDF shows this every year in the highlights and low light reels.

2

Among the other good points mentioned, races at the elite/pro level (that aren't short track) are not won by solely through achieving the highest average speed. The difference is whether the competitor can produce the best power output, at the most opportune time. To make a vast generalisation, you ride at the same average speed as you competitors, except for a fraction of the race where you are a fraction of a percent faster, then you will win. This small increase in power output may not have much affect on the overall velocity.

Team cycling strategy hinges on putting the strongest cyclist in the best position to make this exertion. For flat races, this means getting your sprinter to the front of the pelaton in the final few hundred meters. In mountain stages, getting your climber in position to let their superior muscle-to-weight ratio and efficiency win out.

1
  • Fair points, but the measure here was the overall winner's total time, not the winner of each stage. And besides, on flat stages that come down to sprints, usually the top riders all get the same time as the sprinters.
    – tdc
    Commented Jan 19, 2012 at 7:07
2

This has been a really good discussion! As for bike technology being better today than in the past. I disagree somewhat. I have two high end bikes, one from 1998 and one from 2011. My time over my training course is almost identical. The weight diffence is about 3lbs and one is carbon while the other is steel.

The note about looking at TT times. This will not be helpful, as TT bikes about in the 90's were faster than TT bikes today, because the UCI did not have rules around TT bikes. Take a look at what some riders were riding. Some bikes look like the old softride bikes with not seat tube, while other bikes had no downtube. Furthermore it was allowed to race a 700cc wheel in the back and a 650 upfront. On this topic, during part of the 90's a form of areobars were allowed in road races, along with spinnergy and other 'high tech' gear. An interest TT that I always reference is the one that happened in the 1997 tdf. Riis the defending champion had a custom tt bike made for him which cost over 12K (unheard of for 1997). Ullrich on his store bike blew him away. Riis ended up throwing the TT bike in a ditch! Moral, its not the bike, but the engine!

2

In the light of Lance Armstrong's revelations clearly the answer is that doping has played a significant part in race speeds over the last two decades when it was widespread throughout the sport. None of the data during they period can be relied on and indeed the tour has a long history of doping.So much for cyclings healthy reputation.

2

A factor in gauging increasing speeds that I have not seen in this argument is road surfaces.

Especially back in the 30's, 40's and 50's a lot of the roads the Td'F was raced on were paved in gravel or cobble stone roads. Think about that a minute. How much affect on speed does road conditions have and how much of that affect completely neutralizes any technology improvements?

Race your new carbon fiber bike with 23 mm wide tires on a gravel road in a peloton and see what that does to your speed.

I am not smart enough to know the answer but I imagine if you were to run the Td'F almost completely on gravel roads the average speed would drop quite a bit.

I just do not see how you can compare a race from 1933 to 2013 given the difference road surfaces and say that one is faster than the other.

3
  • I was noticing that while watching bits of the TdF this year. Was watching in the gym while exercising so didn't have the best view, but the roads appeared amazingly smooth -- no visible cracks, and what appeared to be very fine asphalt. I'm guessing that France (and the local communities) put a lot of pride (and money) into these roads, making it possible to run tires that appeared to be maybe 15mm wide. Commented Aug 1, 2013 at 3:05
  • @DanielRHicks You would do the same to your house's driveway if it was on TV worldwide once a year ;-) Commented Aug 1, 2013 at 13:10
  • 1
    @BenediktBauer - Yeah, you're right -- my wife would make me do that. Commented Aug 1, 2013 at 19:50
2

Are we being defrauded by companies trying to sell us all sorts of products (carbon whatnots and sugary goo!)?

I think not.

My 1970's bike would really suck now, compared to my 2010 bike. And, the training advice I was given in the past was actually pretty stupid.

So. Nope. We're not being defrauded.

The boys do what they do for making it.

Doping at the Tour de France (Wikipedia).

Why aren't Tour de France riders going any faster?

  1. Decreasing the bike weight and technology improvements have reached the current limit/rules for the Tour de France.
  2. Doping is not allowed. (Curtailed at least)
  3. The biological possibility of the riders is now very near the limit of human biology. (A question: Are we at the limits?)
1

A factor? The amount of "road furniture" has increased in the last 15 years, to shape road behavior for automobiles. For a single bike this won't be much of an effect, but for the peloton...

0
1

The other answer is about "Game theory". The game is likely a typical "Prisoner's dilemma"

Ref: https://en.wikipedia.org/wiki/Prisoner%27s_dilemma

To stand on the Podium is the only goal of the game but the avg. speed is not the key factor of the game.

In order to stand on the podium, cyclists need to ride within the peloton or a group of leaders.

No matter in the peloton or leading group, everyone wants to win and also prevent from the others use his efforts to win. Hence, the optimized strategy obstructs the speed of the leading group.

Only if UCI changes the rule of the game, or people's focus switches to the avg. speed. If not, the situation will not change. Again, only the game rule changes then the result will changes, or the current situation is the optimized and stable and it will not change much.

0

Besides the information others have replied with, the numbers provided show a sustained 0.4% growth rate over 109 years. Over the last ten years, we should expect a 5% expected growth in output.

5% isn't actually that large a jump; especially when you consider the variability of the data. It's not out of the realm of possibility that unrelated external factors have kept speeds from increasing. In fact, you'll notice on that graph that from the mid 1950s to the early 1980s (around a 25 year span) growth was flat as well.

One of those external factors is likely stricter controls on doping. Given that there's been a significant crackdown in the past decade, it's actually quite astonishing that we've managed to break even. A simplistic way of looking at it is that availing yourself of the last decade's worth of advances in technology and nutrition confers upon you the same advantages that (some significant amount of) doping would have given you ten years ago.

4
  • I'm sorry, but your reasoning sounds flawed. An overall average can happen with a logarithmic curve, or reaching to a limit. Expecting a 5% growth for 10 years after seeing a growth of 50% over 100 years is not reasonable then, and in fact, our data basis is just asking, why there is no 5% increase in the last 100 years. Commented Jan 24, 2012 at 23:47
  • I'd love to respond to your comment, but it quite literally does not make any sense. Would you mind rewriting it so I can have the faintest idea what your objection is? Commented Jan 25, 2012 at 15:32
  • The data shown in the question shows the stagnation in the last 10 years, but you take your claim of 5% increase in speed over 10 years from exactly that data. So where is the contradiction? Maybe you're not allowed, to build an overall average, and ask where it was in the last 10 years. (If there would have been such an increase, it would have been an overall increase of 55% - wouldn't it?:) ). So if there is no linear progression, you can't base your expectation on it. From a more practical viewpoint, how fast would a cyclist be in the year 2110, 2210, 3010, 12010? Commented Jan 25, 2012 at 15:52
  • I agree that the graph may not be linear. The point of the post wasn't to establish that a 5% growth was expected, but to point out that the expected growth should be small compared to the variability inherent in the data. If anything, assuming a sub-linear growth rate makes that point even more valid. Commented Jan 25, 2012 at 16:19
0

Due to the constantly changing course a certain amount of variation in average speed is expected. Over time however, I suspect this in not an issue as the course organisers tend to regress to the mean – some years the course is ‘tougher’, other years ‘easier’. It’s true that a comparison between two years is not really possible, but it’s acceptable to consider the general trend over the race’s history. (Although it’s certainly true that the Tour is significantly different today than when it first started).

Some comments refer to increase in wind. Again I suspect this to not be an issue as slower speeds due to stronger head winds would be cancelled by faster speeds due to tailwinds.

I feel the change in speeds has primarily been driven by two factors – technological improvements and doping. The bikes have become lighter and more efficient at using the power output by riders through such innovations as carbon and titanium materials, clip in pedals, aerodynamic wheels and apparel etc. EPO in the 90s/2000s is generally considered to have played a significant role in the increased average speed of that time. Many cycling commentators believe (sorry no references) that the peloton is now mostly clean which is reflected in the slower average speed. Another good alternative measure to average speed is vertical ascent meters (or VAM), which has also dropped from the Pantani / Armstrong peak.

Thus, to answer your question, I believe the stagnate average speed experienced over the last 5 or so years is primarily due to a clean - dope free peloton.

I’ll update with reference if I get a chance.

2
  • The race distance has not regressed to the mean, rather it has consitently decreased over the years; see the additional plot in my answer. I downvoted you because the speculation ("I feel...") on doping and technology is not borne out by either chart provided.
    – nick3216
    Commented Jan 24, 2012 at 16:26
  • I didn't write that the distance has regressed to the mean, I wrote that some years it's 'tougher', others 'easier'. Tough and effective doping control over the last 5 or so years leading to a slower average speed is borne out in the first chart. Your chart suggests an impressive correlation, but I can't help feel that the modern peloton would average around 40 or 50km/h (or possibly even higher) over the relatively flat 1903 course - due to the huge technological advantage.
    – Murray
    Commented Jan 25, 2012 at 5:00
0

The is no comparison of the experienced people to the new one who has participated for the first time in this kind tournaments. I think more someone practice for the event more are the chances to win There's a lot of errors here. Flatland speed comparison seems to be solo rec rider vs pro pack. 17-18 is a good number for a solo rec rider riding comfortably, but the pros only average 25-28 solo if they're freaking drilling it or with a group, just look at the average speeds from flat stages. The same thing goes for average speed in the mountains. 9-10 is about right for the just the climbing part for an average joe, but then you compare it to overall average for the climbs and descents for pros. Should be more like 14-15 vs 21-25. Very misleading. I'll simply echo what everyone else has stated about the calorie consumption. Misleading and in some ways simply wrong. Even the bottles of water is misleading as it lists bottles per hour for average joe and then overall stage use for the pros. Comparisons should be made based on the same statistics, not on metrics distorted to make a point.

1
  • Hi Momo, and welcome to Bicycles. Your answer would be better if it "stood alone". As it is, it seems to rely on other information. Also, could you add units (eg kph or mph) to the numbers you have included, so that your readers understand the points you make?
    – andy256
    Commented Sep 22, 2014 at 7:39
-1

There are so many influencing factors involved here it is a really complex discussion, but in my view one of the key differences comparing bikes of today with what Merckx or Hinault would have ridden is the basic mass. The bikes are literally half a stone lighter now - 15 lbs for a current UCI legal machine vs. 22lbs for a 'vintage lightweight' with 531 or Columbus SL frame. This translates to roughly 5 percent in all up weight - which is very significant in a sport where the athletes are striving for just 3-4 percent body fat. When you consider all those alpine ascents, all those little accelerations out of corners, that half a stone is enough to make a real difference. I can't prove it, but I think it quite feasible that 1.5-2 of those 5 kph ( since Merckx's days) could easily be accounted for by the weight reductions alone. Tyre technology is another important factor - I wouldn't be at all surprised if the bikes are 1-1.5 kph quicker on average just through improved rolling efficiency. Clearly, enhanced training methods and nutrition will have had some impact over the last few decades, but I tend to think that bike technology has been far and away the biggest contributor to the speed incease. Aside from the component technology, you'll also notice that riders today tend to sit a fair bit higher on their machines. As Eddie B discusses in his training bible, races have become progressively shorter, so it is possible to run the saddles higher with an immediate, substantial, bio-mechanical advantage. Similarly, the bars have got progressively lower relative to the saddles which again is probably a reflection of shorter races and enhanced rider flexibility - regular stretching now being well recognised as an essential ingredient in overall fitness. Lower bars equal a flatter back, with subsequent aero benefit. Roads have undoubtedly improved greatly since the fifties, which is a factor in itself. In another sense, the billiard smooth resurfaced roads of today have facilitated super stiff contemporary bikes which would be otherwise unridable on a three week bike race. My conclusion to this is that Fausto Coppi (time-warped from the nineteen fifties) set up on the latest technology, with a modern position, would certainly give Mr Wiggins a good run for his money!

1
  • 2
    You seem to be explaining why TDF racers are getting faster. The question is, with all the modern advances, why aren't they faster than they are.
    – jimchristie
    Commented Nov 24, 2013 at 21:02
-2

Average speed depends on distance, altitude profile, road surface, tactics, weather, equipment, training methods, nutrition etc. That makes any average speed chart useless.

1
  • 3
    Welcome to Bicycles! We're looking for answers with more detail. Please give us some reasons and explanation, not just a one-line answer. A short answer like this with no explanation is likely to be deleted
    – tdc
    Commented Jan 24, 2012 at 16:09
-3

the race is a individual route every year . you would need distance ,incline angles, wind factors and get a base . then you would have to match each race with these factors . so if it was a longer distance you find areas that match the base until all wind incline and distance is used from each race are matched perfectly to the base . say 15 degrees incline so you would have to search each year to match this 15 degrees for the same distance and you use these times if they are faster or slower. as you will never tell by simple results

1
  • 3
    Welcome to Bicycles SE. We ask that you write to the best of your ability on this site. This means proper capitalization, proper punctuation, and complete sentences. If you don properly format your answer, it is likely to be downvoted and possibly deleted.
    – jimchristie
    Commented Jan 15, 2015 at 2:36
-3

People seem to be over complicating things here as normal. The points made in the opening question and graphs relate to, primarily, the lack of change from 1990 to 2010. Yes there are peaks and troughs, yes changes in distance and course, tactics and weather all make a difference but all these even out and we can make assumptions and generalisations. - The elephant in the room is that since aero wheels and tri bars came in for time trials bicycles have not become any faster in the real world. This happened about 1990. Zipp firecrests in a bunched peleton make so little difference its just noise in the results. 320 tpi tyres have been around forever, arguably riders positions were better in the past when they didnt feel the need to have their knuckles on the front tyre. As now shown in several studies frame stiffness slows you down in both sprints and sustained efforts ( why are we told to spin despite having frames as stiff as granite ?!, surely its the other way ) . Of course the other factor is that humans haven't changed either. The fastest tyres are now faster marginally and more puncture proof . Aero wheels are technically faster in a break away, but also more stiff so beat you up more and create a 'bumpy' ( unsprung mass and loss of inertia) ride.A C record crankset is plenty stiff enough to transmit power, maybe here you gain power from a modern BB interface in a sprint, but at least in my experience you gain bearing drag all day. Modern carbon soled shoes ? i'd love a scientist to explain how that works ! ...you press down on the small pedal spindle ( pedal rotates) with a soft fleshy foot via the ankle joint, sorry. When you take into account modern scientific monitoring, performance aids like power meters, gels, creatine etc...its amazing how slow the riders are now. The intimation of the question is that surely modern bikes make us faster, the answer is they have made riders slower when taking into account the factors mentioned above and by other commenters. This is not a surprise to me, on my 531 frame and brooks saddle, with specialised turbo cotton tyres NOTHING rolls faster. This is because the bike does everything in its power to keep your inertia rolling forward. oversize alloy frame with deep carbon wheels and a hard saddle ? thats a LOT of inertia being lost to gravity on the unsprung mass.

2
  • Does this address the question of why aren't they going faster ? Please read the tour to learn how SE is a Q&A site not a chatty web forum.
    – Criggie
    Commented Apr 1, 2018 at 22:17
  • 1
    As far as I can tell, this answer claims that the athletes may have improved over the years, but modern bikes are slower than the ones used in 1980s. In my opinion this is rather implausible.
    – ojs
    Commented Apr 6, 2018 at 19:57

Your Answer

By clicking “Post Your Answer”, you agree to our terms of service and acknowledge you have read our privacy policy.

Not the answer you're looking for? Browse other questions tagged or ask your own question.