5

Prompted by a comment on a recent question about weight loss I started to wonder: for people who ride bikes at least sometimes, what's the distribution of maximum distances? This has also come up in discussions among distance riders about cycling infrastructure for mass use. Or, to put it another way, how abnormal are those of us who like to ride a long way?

Ideally this would be a survey of the maximum distance people have ridden/typically ride, but as that's unlikely, it's be interested to see anything that sheds light on the question. While I'm in the UK, an international picture would be more, not less, interesting.

I've seen some UK stats from cyclinguk and some walking & cycling UK national data, but they are either based on acceptable commuting distances or don't capture variation.

6
  • 2
    You could probably buy the information from metro.strava.com but it would of course have the caveats discussed in the existing answers about strava data. I had a look at the strava developers API, but as far as I can tell it requires authentication by each athlete you wanted to query data for.
    – Andy P
    Commented Oct 8, 2018 at 9:54
  • @AndyP that's the issue with Strava data - it's personally tagged and gives quite a lot away. I think rides are opted in to metro by default in some vaguely anonymised way and unless marked private, but I'm not sure because I assume that pretty much everything I put up there is public, so am careful about what I upload
    – Chris H
    Commented Oct 8, 2018 at 10:42
  • Can these routes be exported as GPX or KML files?
    – Larry Lo
    Commented Oct 28, 2018 at 5:37
  • Welcome to the website! You answer is looking more like a clarification question for the original poster, which in terms of this site really belongs to the comments section. Please take 5 minutes to read through the tour Commented Oct 28, 2018 at 15:33
  • The question is about statistics on distances, not routes. Did you put your answer in the wrong place? Sounds like it should be a comment on the "tour de france routes" question.
    – Criggie
    Commented Oct 28, 2018 at 21:56

2 Answers 2

4

Here's an article focusing on some of the most active cycling cities around the world, and this is reporting averages, not maxima. The source data they link to at Strava isn't available to me (redirects to the Strava login page, and I don't have a Strava login).

The data is probably biased towards more serious cyclists--I'd be surprised if the average commuter in Amsterdam is bothering to log in to Strava every time they go out.

1
  • Even logged in the insights.strava.com link fails for me. It appears to have been a one-off project. It's still interesting. Strava labs indicates that the datasets exist (and a strava dataset would be a good place to start) but it doesn't appear to have been analysed in the right way for me.
    – Chris H
    Commented Oct 6, 2018 at 20:21
3

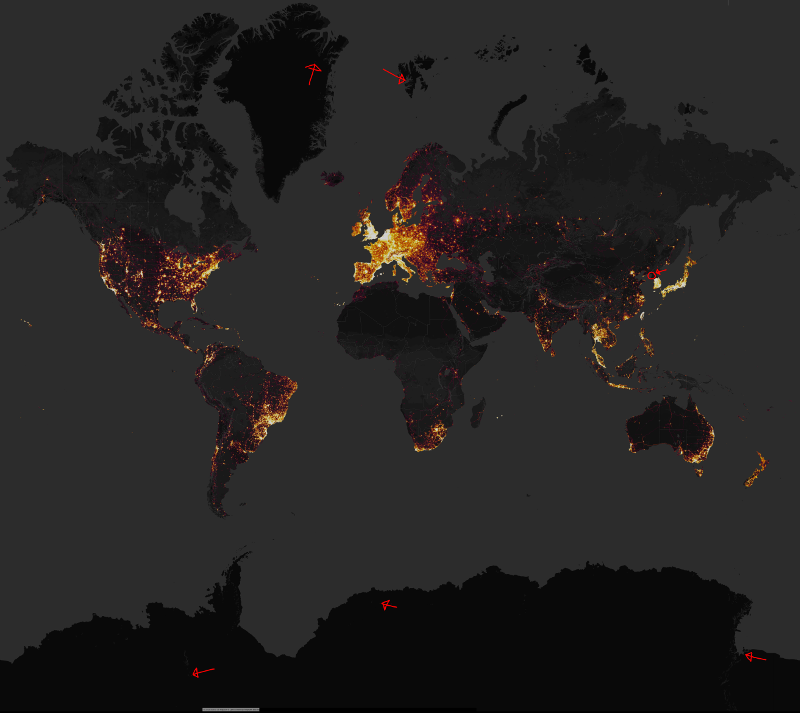
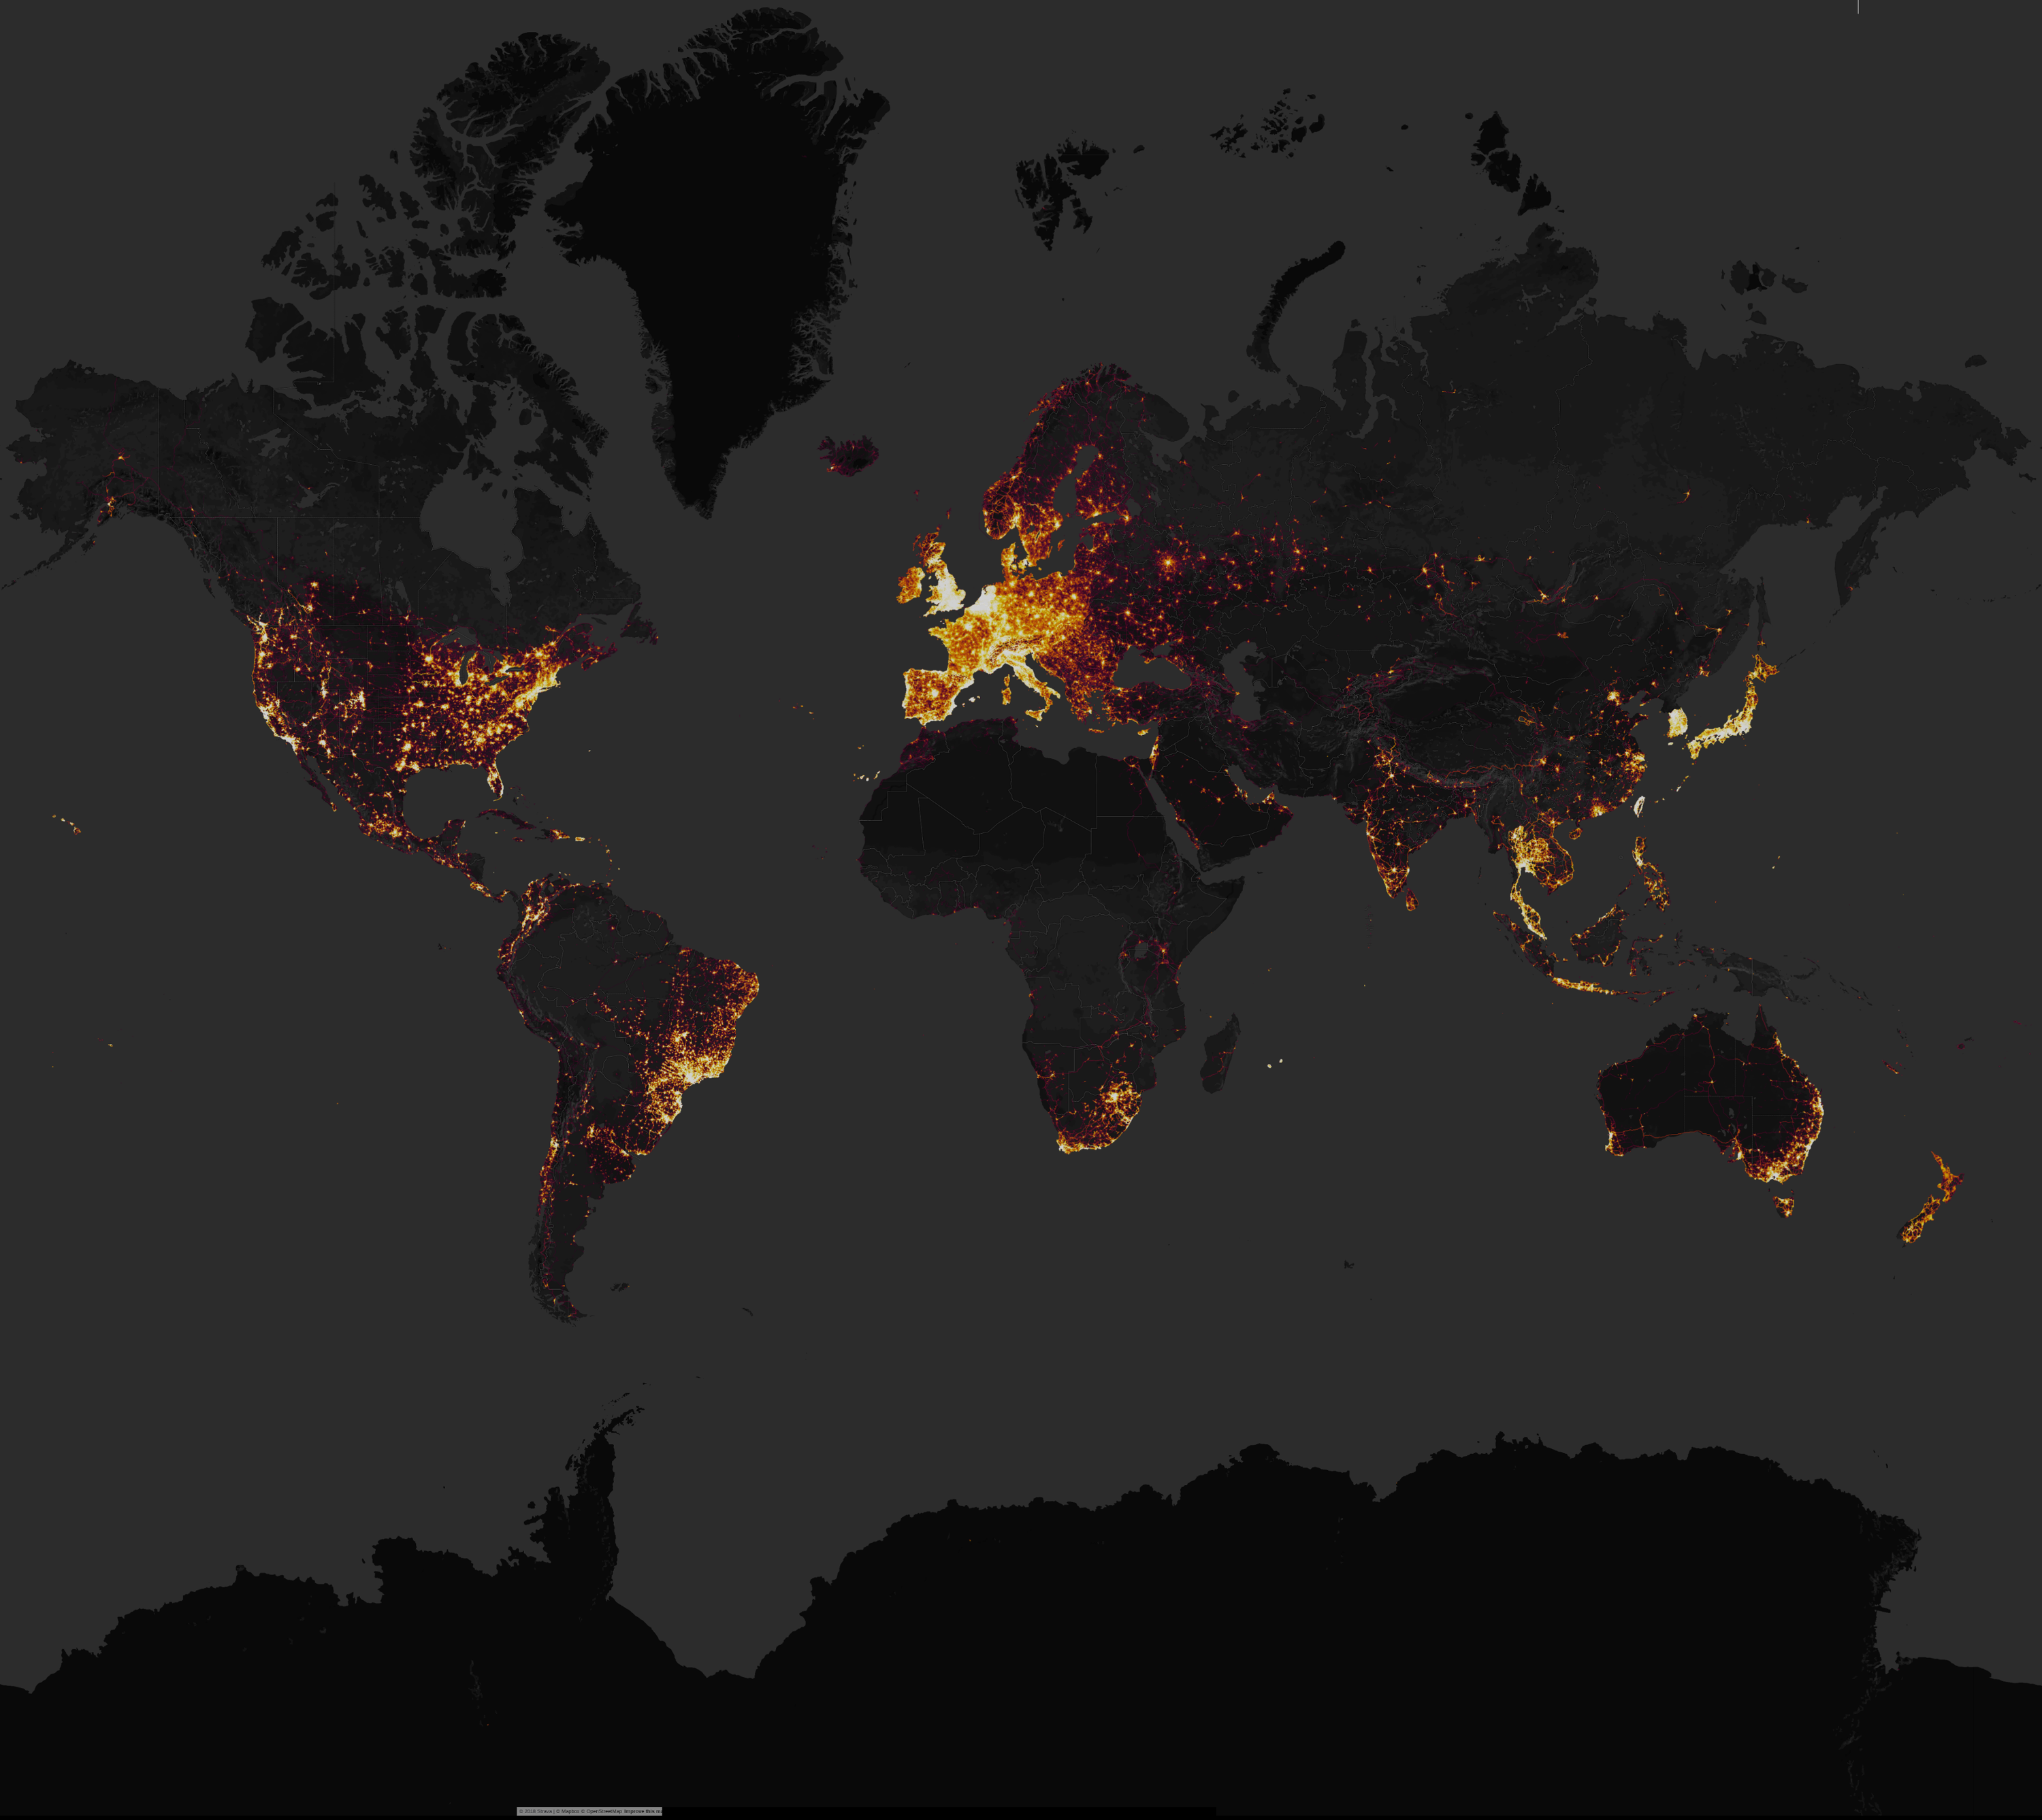
Addendum to Adam's answer - here's the heatmap for 2017.

enter image description here

Was hard to get it under 2 Mbytes for upload.

Big version is at https://imgur.com/a/uiDcKxL


There's heaps of interesting things in that map:

Interesting

  • Three separate areas in Antarctica
  • Two in the Arctic
  • One point in North Korea where strava is used
  • From overhead, the world's leading strava/cycling countries are UK, France, South Korea, Japan, Taiwan, Italy, and various places around Asia. (admittedly this is somewhat self-selecting as Africa should have a lot more riding, but less strava interest)
  • Some tiny islands have an inordinate amount of riding for their size.
8
  • 5
    The limitations of Strava as data source show on these heat maps. Strava displays where people ride for sport and are affluent enough to track these rides with tech. It does not show typical utility riding. Who would track their 4 km ride to work or quick ride down the street to the bakery
    – gschenk
    Commented Oct 6, 2018 at 22:10
  • @gschenk whistles-innocently At least I mark my dog walks as private to not clutter other's feeds.
    – Criggie
    Commented Oct 7, 2018 at 1:14
  • 1
    For me the limitations of the heat map are that it measures roads rather than rides so it's close to a population measure, while I'm more interested in what that population does.
    – Chris H
    Commented Oct 7, 2018 at 7:20
  • 2
    OK, road track or whatever, but if a 100km road between two towns is used along the whole length, is that a few 100km journeys or lots of shorter journeys with intermediate stops. To approach from a different direction, most riders only go a little way per journey, so is there any point building bike lanes that are only useful for people riding long distances (e.g on main roads without intermediate destinations)? How many people for a given value of long
    – Chris H
    Commented Oct 7, 2018 at 9:03
  • 1
    What that heat map is telling me is a similar number of people ride bikes in Antarctica, China and India. Clearly the data set is not representative.
    – mattnz
    Commented Oct 7, 2018 at 22:52

Your Answer

By clicking “Post Your Answer”, you agree to our terms of service and acknowledge you have read our privacy policy.

Not the answer you're looking for? Browse other questions tagged or ask your own question.